Business Intelligence
In the modern corporate world, data is frequently described as the new oil. Every single transaction, website click, customer inquiry, and inventory movement generates a digital footprint. However, raw data by itself is just noise. Without the proper systems to collect, clean, organize, and interpret this information, organizations are left drowning in numbers while remaining starved for actual insights. According to industry reports, the total volume of global data is growing exponentially and is expected to reach massive heights, yet businesses traditionally leave a staggering 97% of their gathered data completely unused.
This massive gap between data collection and true understanding is exactly why Business Intelligence (BI) has become a fundamental pillar of modern enterprise strategy. The global business intelligence market size was valued at 34.82 billion USD in 2025 and is projected to scale from 37.96 billion USD in 2026 to over 72.21 billion USD by 2034. This rapid growth, moving at a steady compound annual growth rate of 8.40%, highlights how critical data infrastructure has become. Organizations are no longer viewing data analysis as an occasional luxury. Instead, it is an absolute necessity for survival and growth.
Understanding Business Intelligence: What is BI?
At its core, Business Intelligence is a technology-driven process designed to analyze data and deliver actionable insights that help executives, managers, and operational workers make highly informed business decisions. BI encompasses a wide variety of tools, methodologies, applications, and best practices. It enables organizations to collect data from internal systems and external sources, prepare it for analysis, develop queries against that data, and create accessible reports, dashboards, and data visualizations.
The primary goal of BI is to drive better business decisions. It allows companies to see historical trends, monitor current operational performance, and spot anomalies before they turn into expensive structural problems. Rather than relying on guesswork, intuition, or outdated monthly reports, BI gives teams a clear view of reality based on hard data.
The Core Components of a Business Intelligence Architecture
To truly understand BI, it helps to break it down into its core infrastructure components. A functional BI setup relies on a well-planned pipeline that moves data cleanly from its origin to the end-user.
- Data Warehousing: This is the centralized repository where data from multiple disparate sources (like CRM systems, ERPs, financial tools, and marketing platforms) is consolidated and stored securely.
- Data Cleansing and Integration: Raw data is notoriously messy. This component involves cleaning up duplicates, handling missing data points, and standardizing formats so that everything can be compared accurately.
- Data Mining and Analytics: This phase utilizes statistical models and machine learning algorithms to uncover hidden patterns, correlations, and trends within large datasets that might not be visible to the naked eye.
- Data Visualization and Dashboards: This is the user-facing side of BI. It translates complex database queries into intuitive charts, graphs, heatmaps, and interactive dashboards that any employee can understand at a quick glance.
How Business Intelligence Works
The operational mechanism of Business Intelligence follows a logical, cyclical flow often summarized through data engineering practices. It bridges the gap between technical data storage systems and everyday business operations.
First, data is collected from various operational touchpoints. This includes your sales software, customer support tickets, web analytics, supply chain logs, and financial records. Once collected, this data goes through a critical step called ETL, which stands for Extract, Transform, and Load. During this phase, data is pulled from its native silos, transformed into a consistent and clean format, and loaded into a centralized data warehouse.
Once the data rests safely in the warehouse, the analysis phase begins. Users can run complex queries using Online Analytical Processing (OLAP) systems or simple drag-and-drop interfaces provided by modern self-service BI platforms. Finally, the system presents these findings through real-time dashboards. This structured progression ensures that instead of scrolling through endless rows on a spreadsheet, a manager can view a clean bar graph that clearly displays weekly performance metrics, allowing them to shift strategies immediately.
The Transition From Data Extraction to Insight Generation
What makes modern BI setups in 2026 so different from old reporting methods is the speed and accessibility of the data pipeline. Traditional reporting was passive and backward-looking, often taking data scientists days or weeks to assemble a single static report.
Today, modern BI architecture operates through automated, real-time data pipelines. The moment a transaction occurs, the data is instantly processed, verified, and reflected across all company dashboards. This level of immediacy shifts analytics from a defensive posture to an offensive business strategy.
Top Benefits of Business Intelligence for Modern Enterprise
Investing in a robust Business Intelligence framework yields substantial, quantifiable returns. Research indicates that the implementation of a comprehensive BI solution can result in an impressive 127% return on investment within just three years. Let us explore the primary benefits driving this value.
Faster and Data-Backed Decision Making
In a fast-moving market, delaying a major decision by even a few days can cost a company its competitive edge. Studies show that organizations utilizing real-time data analytics reduce their overall decision-making time by an average of 30%. Because BI platforms deliver up-to-the-minute metrics, executives can confidently make strategic shifts based on verified operational reality rather than relying on gut feelings.
Improved Operational Efficiency and Performance Tracking
BI tools allow companies to establish clear Key Performance Indicators (KPIs) across every department and monitor them continuously. If a manufacturing plant experiences a sudden drop in output or a customer support team sees an spike in resolution times, the BI dashboard flags the anomaly instantly. This immediate feedback loop allows operational leaders to pinpoint inefficiencies, allocate resources effectively, and eliminate operational bottlenecks before they impact the bottom line.
Enhanced Customer Insights and Market Profiling
Understanding consumer behavior is vital for sustainable growth. According to data from McKinsey, data-driven organizations are 23 times more likely to acquire customers, 6 times more likely to retain them, and 19 times more likely to achieve superior profitability compared to less analytical peers. BI platforms combine demographic information, purchase histories, and behavioral patterns to create highly detailed customer profiles, enabling hyper-personalized marketing and better product development.
Drastic Reduction in Operational Errors and Financial Losses
Poor data quality is incredibly expensive. Research highlights that the aggregate financial impact of poor data quality costs enterprises an average of 9.7 million USD annually, while contributing to trillions of dollars in losses across broader economic markets. When business systems run without automated checks, errors multiply quickly.
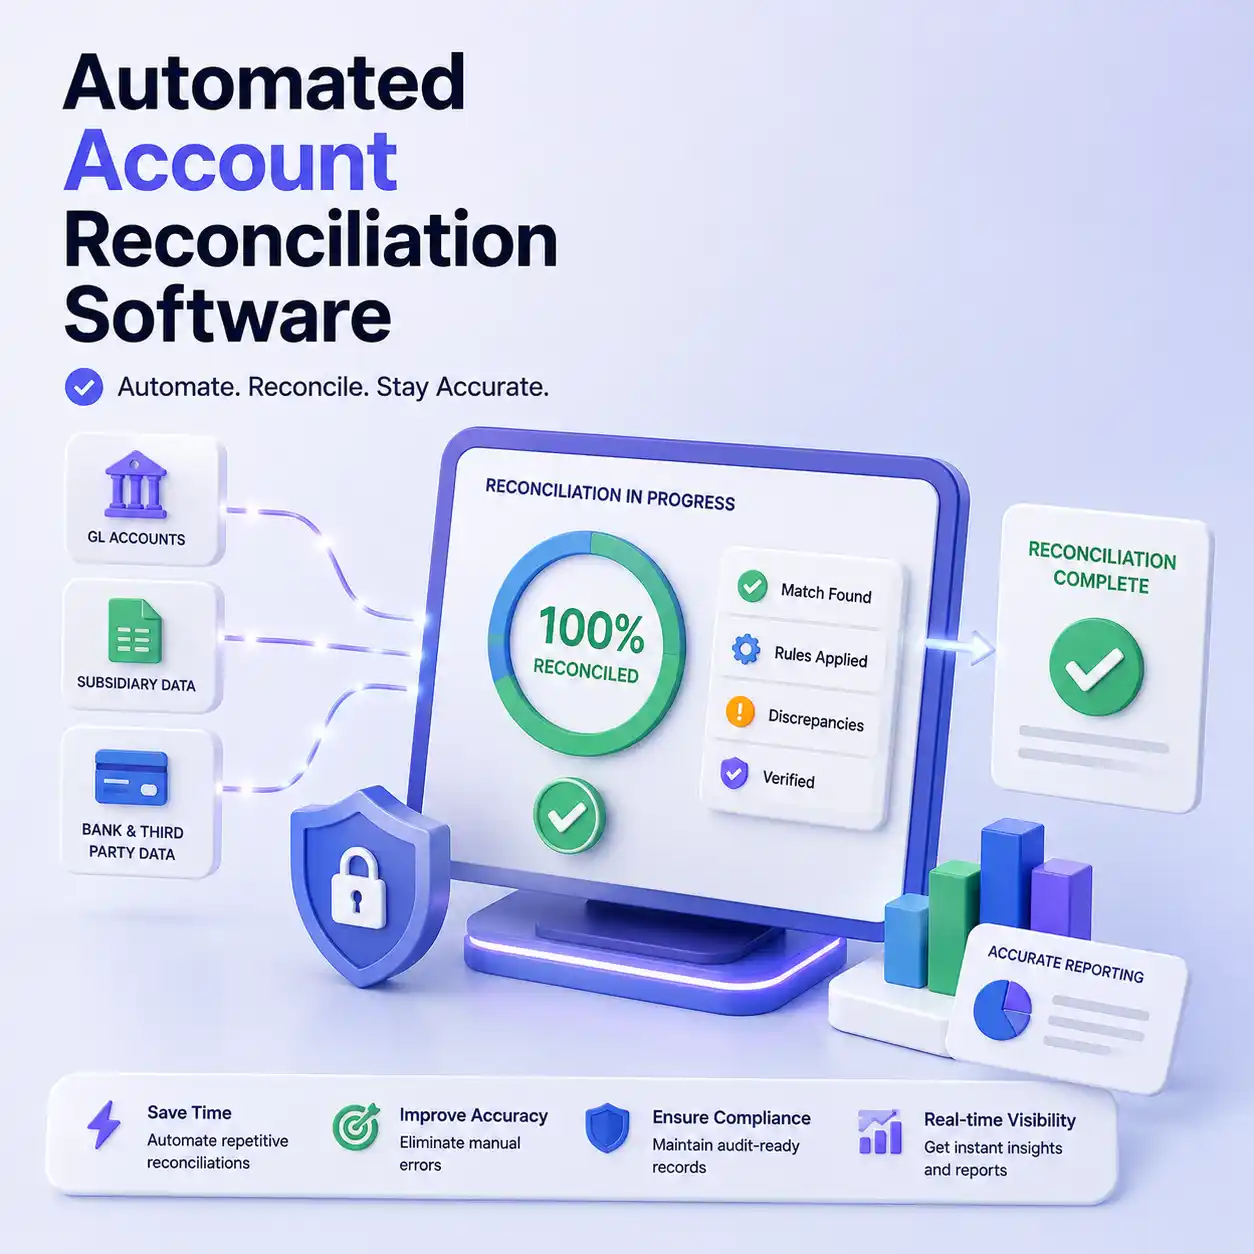
By embedding automated BI analytics pipelines, businesses can link core data systems directly with specialized reconciliation software to maintain absolute data integrity. This automation drastically cuts down on manual oversight, catches data discrepancies early, and protects companies from leaking revenue due to accounting mismatches or technical glitches.
Real-World Use Cases of Business Intelligence Across Industries
To appreciate the versatility of Business Intelligence, it is helpful to look at how different industries leverage these systems to solve real, everyday operational challenges.
BI in Finance and Banking Operations
The banking, financial services, and insurance sector accounts for a dominant share of the global BI market, capturing more than 25% of total revenue. Financial institutions handle billions of transaction points daily, making manual monitoring an impossible task. BI tools are deployed here to manage complex risk profiles, detect fraudulent behavior patterns, and optimize investment portfolios.
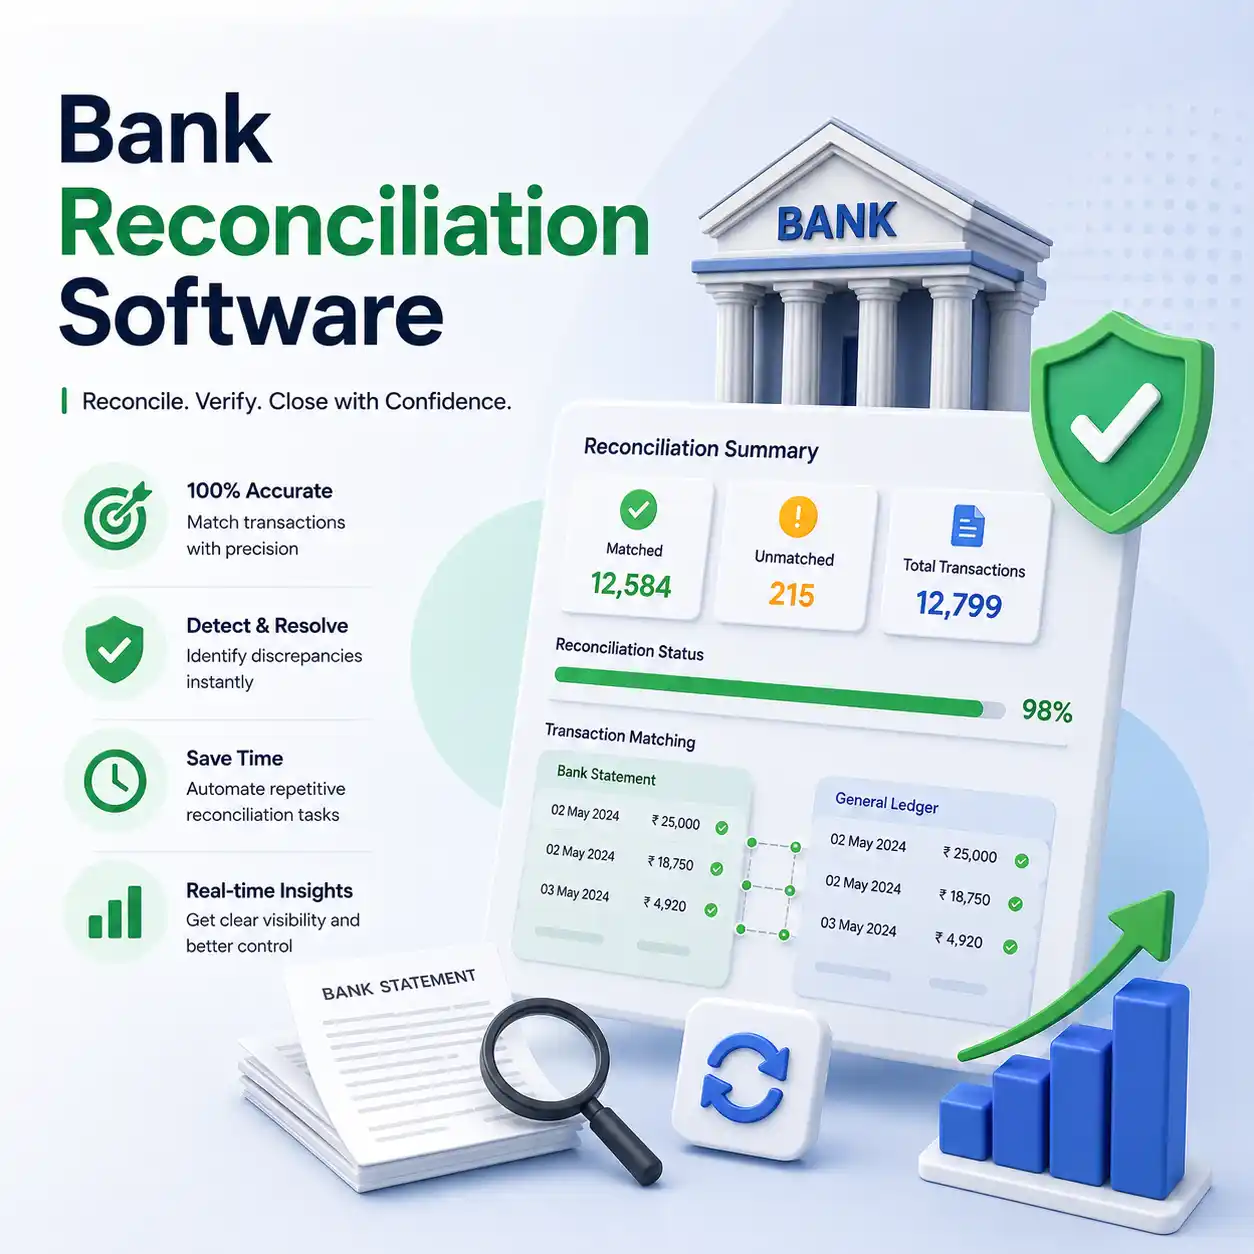
Furthermore, financial departments combine BI tools with high-speed bank reconciliation software to auto-match ledgers with bank statements, turning daily financial balancing into a real-time health indicator. This combination ensures that cash balances remain perfectly accurate, regulatory compliance is maintained, and financial audits proceed smoothly without human errors delaying the process.
BI in Retail and E-Commerce
Retailers use BI to master the complex art of inventory management and demand forecasting. By analyzing past sales trends, regional weather patterns, social media trends, and economic indicators, BI tools can predict exactly which products will sell best at specific times of the year. This prevents retailers from wasting capital on excess stock while ensuring they never run out of high-demand items during peak shopping seasons.
BI in Payments and Revenue Management
As digital payment methods continue to diversify, companies find themselves managing revenue across multiple payment gateways, digital wallets, and regional currencies. BI dashboards help corporate finance teams track processing fees, monitor payment success rates, and spot transaction failures instantly.
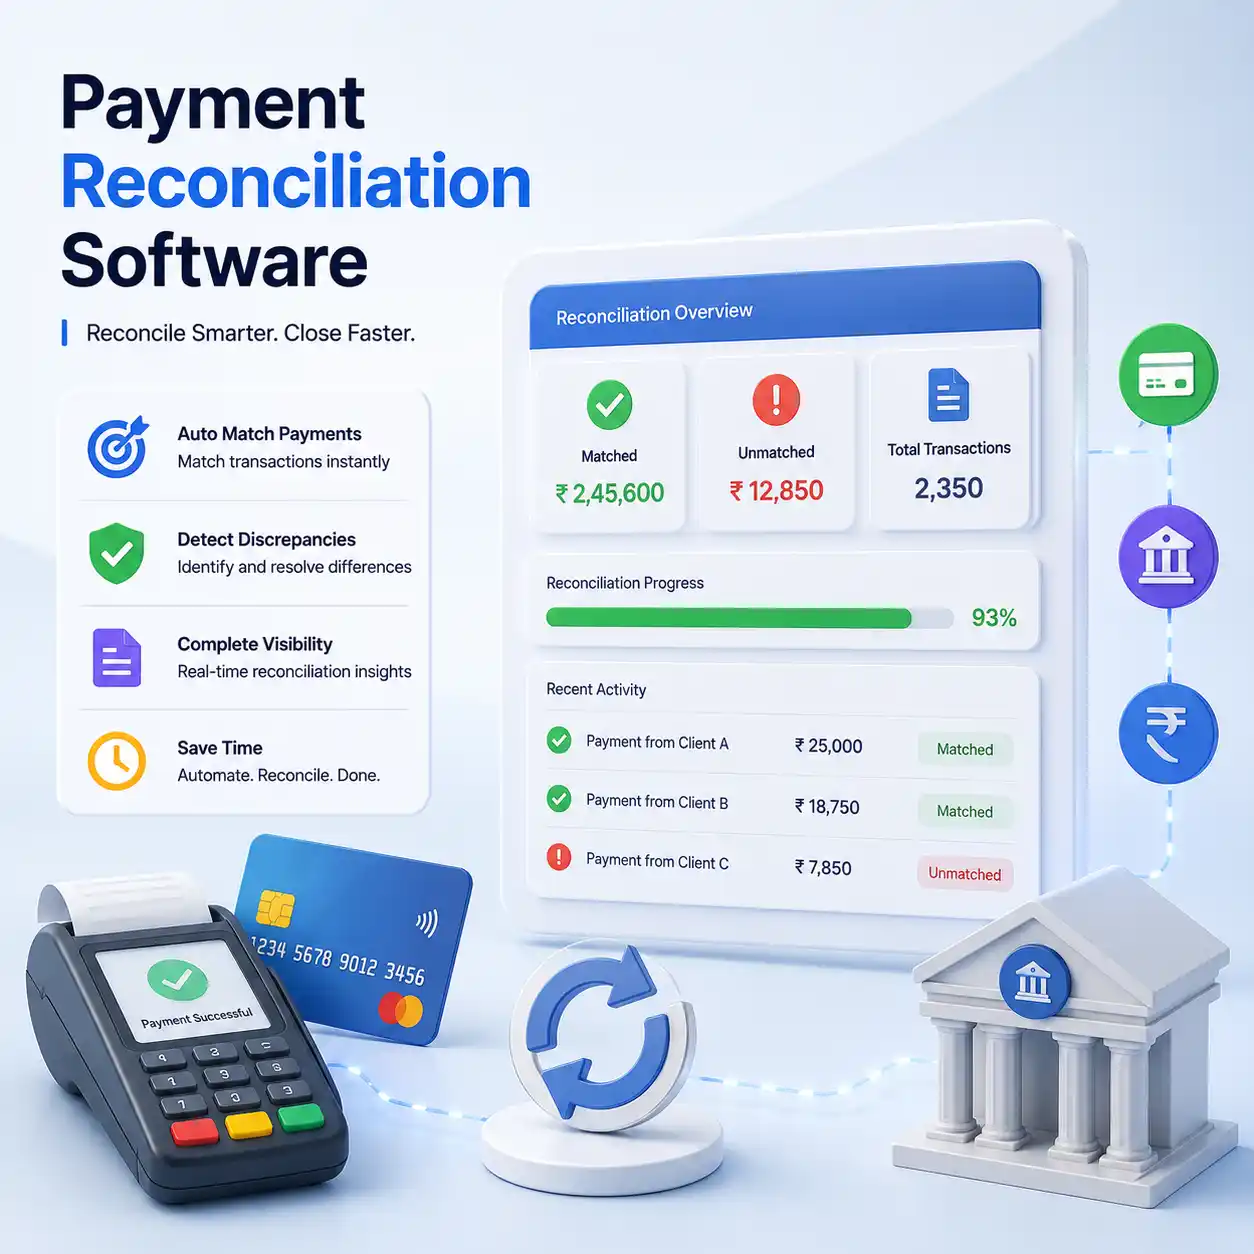
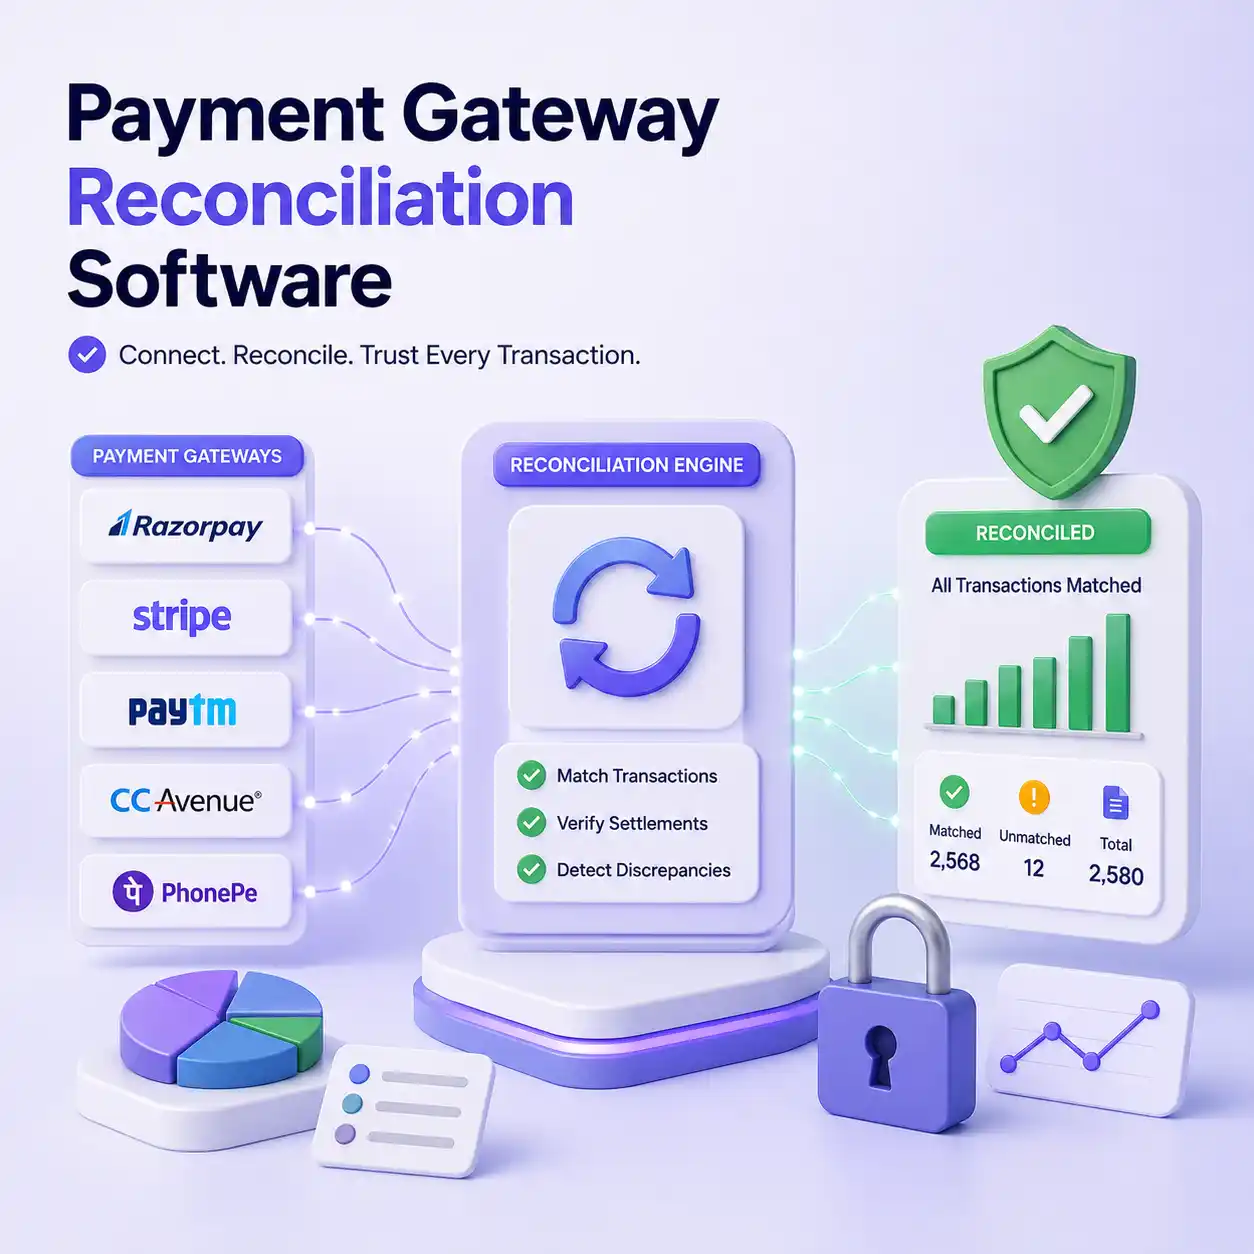
By deploying intelligent payment reconciliation software, organizations can auto-verify gateway reports, merchant records, and internal balances simultaneously. This architecture gives finance managers total control over working capital when paired with reliable cash reconciliation software to secure the ultimate cash position. The visibility provided by this pairing eliminates mysterious financial discrepancies and keeps corporate cash flow remarkably transparent.
BI in Supply Chain and Logistics
Logistics operations use BI to maximize route efficiency, track fleet fuel consumption, and monitor carrier performance. By installing IoT sensors on shipping containers and feeding that real-time location data directly into BI platforms, supply chain managers can easily pinpoint transit delays, optimize warehouse storage layouts, and lower distribution costs significantly.
Business Intelligence Trends Shaping 2026
The landscape of Business Intelligence is undergoing an exciting evolution, driven by advancements in artificial intelligence and a widespread push toward data democratization. The year 2026 marks a clear shift away from passive, static dashboards toward highly active, conversational data platforms.
One of the most disruptive developments is the deep integration of Generative AI and agentic workflows into BI systems. Instead of needing advanced SQL knowledge to extract specific data, everyday business users can now interact with their data platforms using natural language queries. A regional manager can simply ask their BI tool a direct question, such as what were our top three underperforming products in the eastern region last quarter, and receive a comprehensive, visualized report in seconds.
Additionally, the rise of cloud-native, self-service BI software has made corporate analytics highly scalable and cost-effective. Organizations are prioritizing data security, explainable AI models, and real-time anomaly detection, creating a workplace culture where data is accessible, safe, and actionable for every employee across the corporate ladder.
Frequently Asked Questions
What is the main difference between Business Intelligence and Business Analytics?
Business Intelligence primarily focuses on descriptive analytics, meaning it looks at historical and current data to explain what happened and what is currently happening within an organization. Business Analytics, on the other hand, relies heavily on predictive and prescriptive analytics, utilizing advanced statistical data modeling to determine why something happened and forecast what might happen in the future.
Can small and medium enterprises benefit from Business Intelligence?
Yes, absolutely. While large enterprises historically dominated BI tool adoption due to massive budgets, the rise of cloud-based, self-service BI platforms has made data analytics highly affordable and accessible for small and medium enterprises. Smaller businesses use BI to optimize lean budgets, understand customer churn, and scale operations efficiently.
Why do some Business Intelligence implementations fail?
BI projects usually fail due to poor data quality at the source, lack of clear business objectives, and low user adoption rates among non-technical employees. If staff members find the BI tools too complicated or if the data loaded into the warehouse is inaccurate, the organization will naturally default back to manual spreadsheets, rendering the BI tool ineffective.
How does cloud computing impact Business Intelligence?
Cloud computing has completely revolutionized BI by providing massive data storage flexibility, lower upfront infrastructure costs, and faster deployment speeds. Cloud-native BI solutions allow employees to securely access live corporate dashboards and collaborate on data insights from any location, which is vital for modern, decentralized work environments.
What role does data governance play in Business Intelligence?
Data governance establishes the internal rules, data quality standards, and security policies that dictate how an organization manages its data assets. Without strong data governance, a company risk running analyses on bad, non-compliant, or insecure data. Proper governance ensures that the insights generated by BI tools are accurate, trustworthy, and fully compliant with privacy laws.
How does automated reconciliation fit into a company's BI strategy?
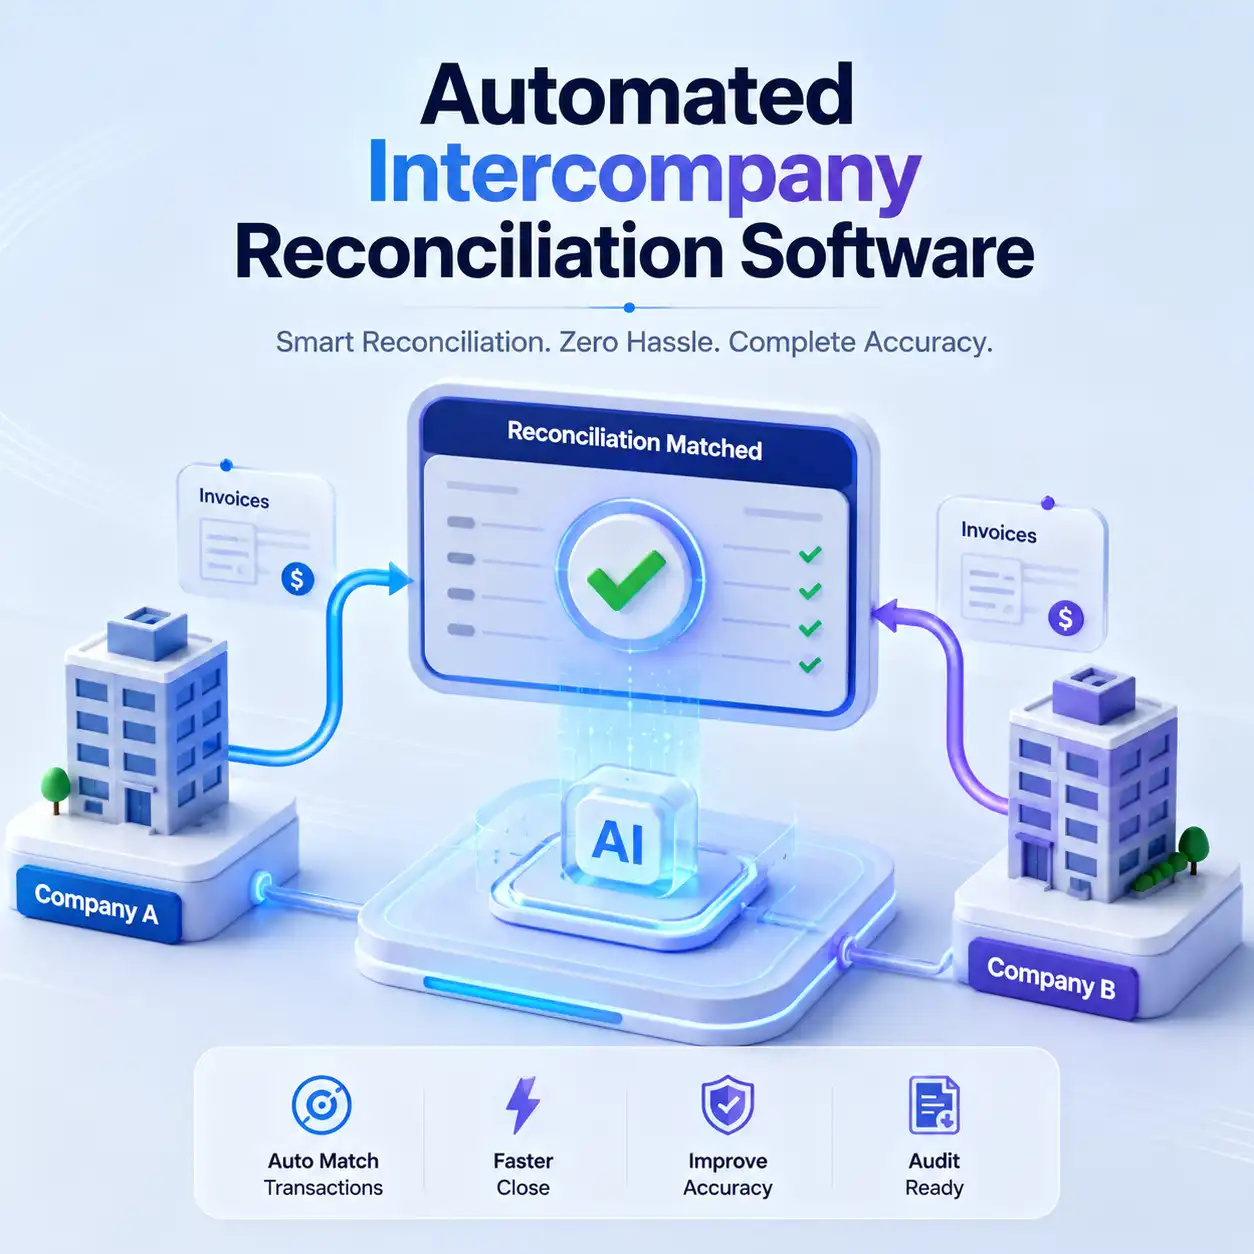
Automated reconciliation ensures that the underlying financial and transactional data feeding into your BI dashboards is completely accurate and free of errors. By automatically matching ledger records, bank statements, and payment gateway files, reconciliation systems eliminate data discrepancies, giving your BI platform a clean, verified source of truth for all corporate financial reporting.
See How Kosh AI Can Transform Financial Close
Contact us now