Knowledge Graphs in Finance
The financial services industry runs entirely on data. Every second, millions of transactions occur, market prices fluctuate, regulations update, and customer behaviors change. However, the real challenge for modern financial institutions is not a lack of data. The challenge is that this information is trapped in isolated databases, spreadsheets, and disconnected legacy software systems.
Traditional relational databases excel at storing isolated rows of data, but they fail to capture the complex relationships that exist in the real world. This is where knowledge graphs enter the scene. By transforming fragmented information into an interconnected network of meaningful entities and relationships, knowledge graphs are completely revolutionizing how financial organizations analyze data, assess risks, and automate complex workflows.
Understanding Knowledge Graphs in the Financial Context
A knowledge graph is a specialized data architecture that represents a network of real-world entities such as people, organizations, bank accounts, transactions, and regulations. Unlike a standard spreadsheet that organizes data in rigid tables, a knowledge graph stores data as nodes (the entities) and edges (the relationships between them).
For example, instead of looking at a customer profile and a transaction log as two separate tables, a knowledge graph connects them directly: [Customer A] -> (Owns) -> [Bank Account B] -> (Initiated) -> [Transaction C] -> (Sent To) -> [Offshore Account D].
This semantic approach provides deep context to data. Financial institutions can integrate both structured data, like transaction logs, and unstructured data, like regulatory documents or news articles, into a single, unified view. The global knowledge graph market is expanding rapidly to meet this need. Valued at USD 1.5 billion in 2025, the market is projected to reach USD 1.7 billion in 2026 and scale up to USD 8.4 billion by 2035, growing at a steady compound annual growth rate (CAGR) of 19.4%. The Banking, Financial Services, and Insurance (BFSI) sector is currently dominating this growth as institutions look for advanced ways to achieve data unification.
Top Use Cases of Knowledge Graphs in Finance
Financial institutions deploy knowledge graphs across various operational divisions to turn highly complex data into actionable business intelligence.
Advanced Fraud Detection and Anti-Money Laundering
Fraudsters and money launderers rarely use single accounts to execute their plans. Instead, they create complex networks of shell companies, shared phone numbers, and circular transaction paths to hide their tracks.
Traditional rule-based fraud systems often miss these patterns because they evaluate transactions individually. Knowledge graphs allow compliance teams to visualize and analyze the entire financial network simultaneously. By mapping the connections between seemingly unrelated accounts, a graph database can immediately expose an active fraud ring sharing the same digital device or physical address.
Holistic Risk Management and Credit Scoring
Evaluating risk in finance requires a deep understanding of external dependencies. If a major real-estate company defaults, how does that impact your portfolio?
A knowledge graph links borrowers to their subsidiaries, suppliers, geographic markets, and industrial sectors. If an economic downturn hits a specific region, risk managers can query the graph to see exactly which clients, loans, and derivative contracts are exposed to that high-risk market. This enables precise stress-testing and highly accurate credit scoring.
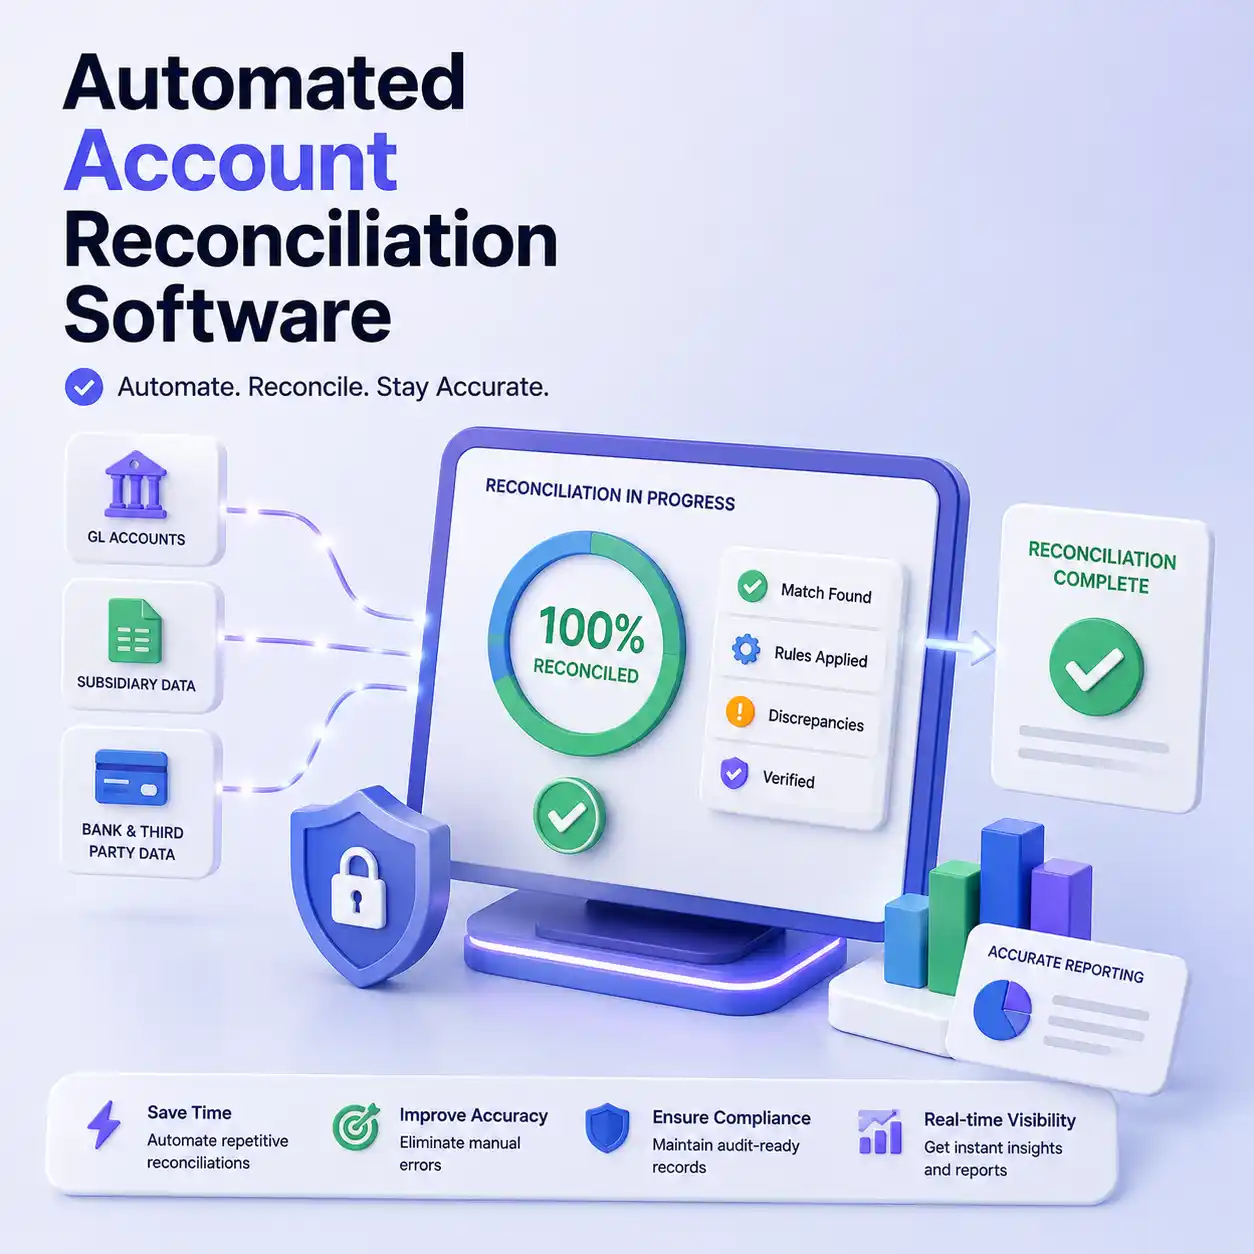
Regulatory Compliance and Automated Reconciliation
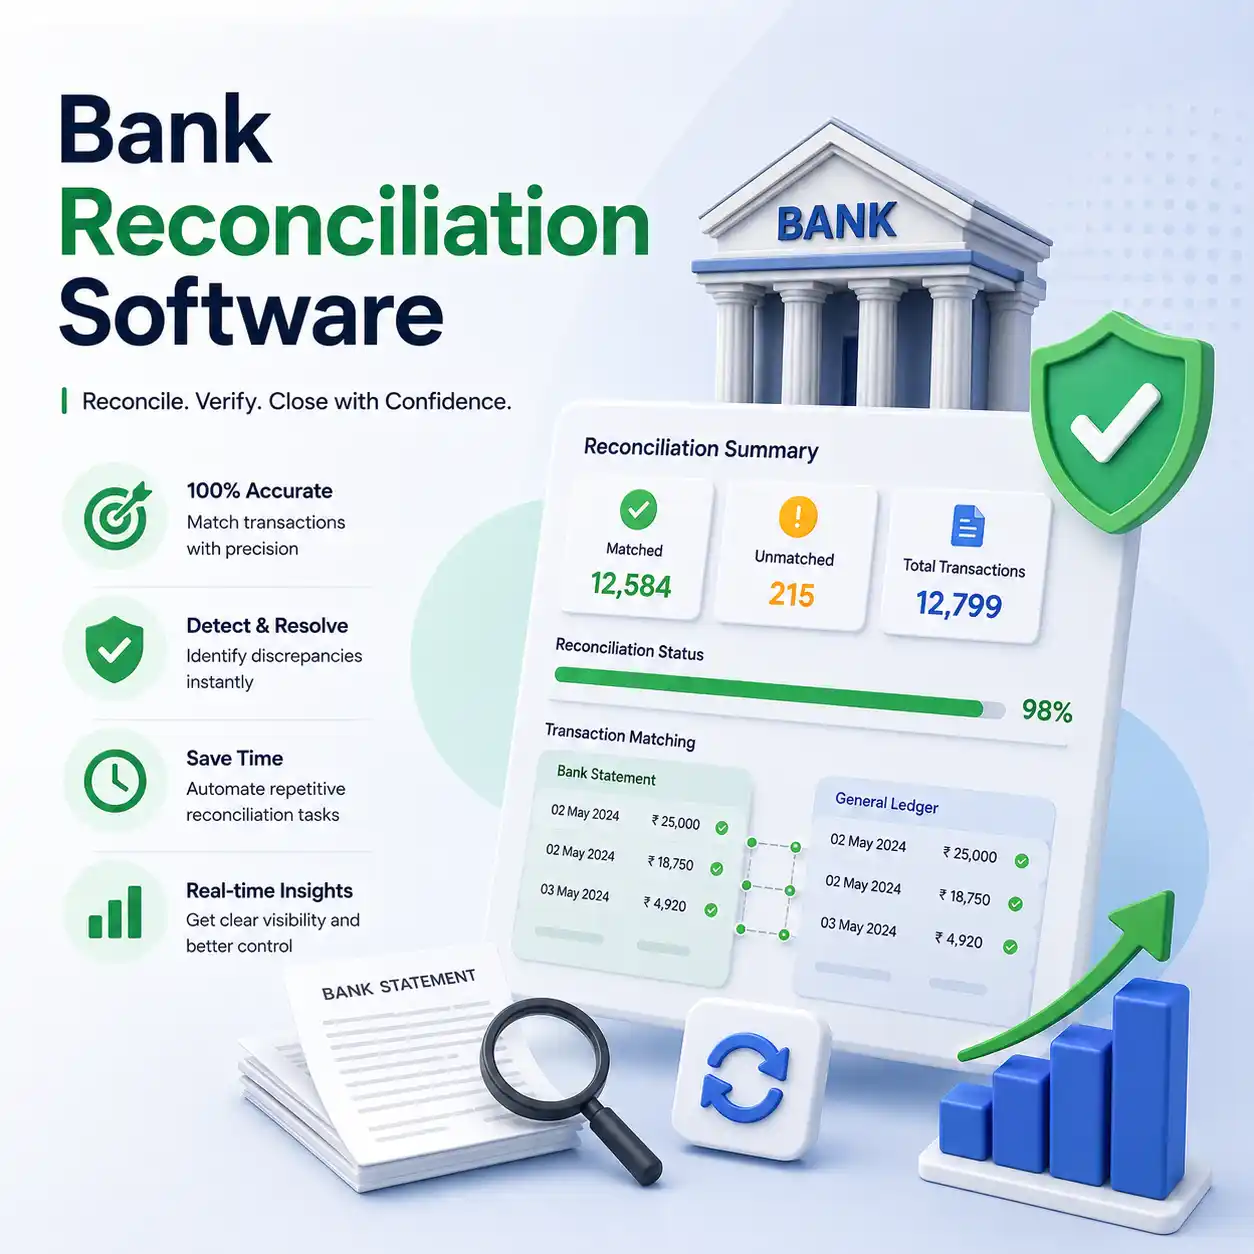
Modern regulatory compliance demands continuous monitoring of operational workflows. Finance teams face the heavy burden of cross-referencing internal ledgers, bank statements, and payment gateways daily to ensure complete alignment.
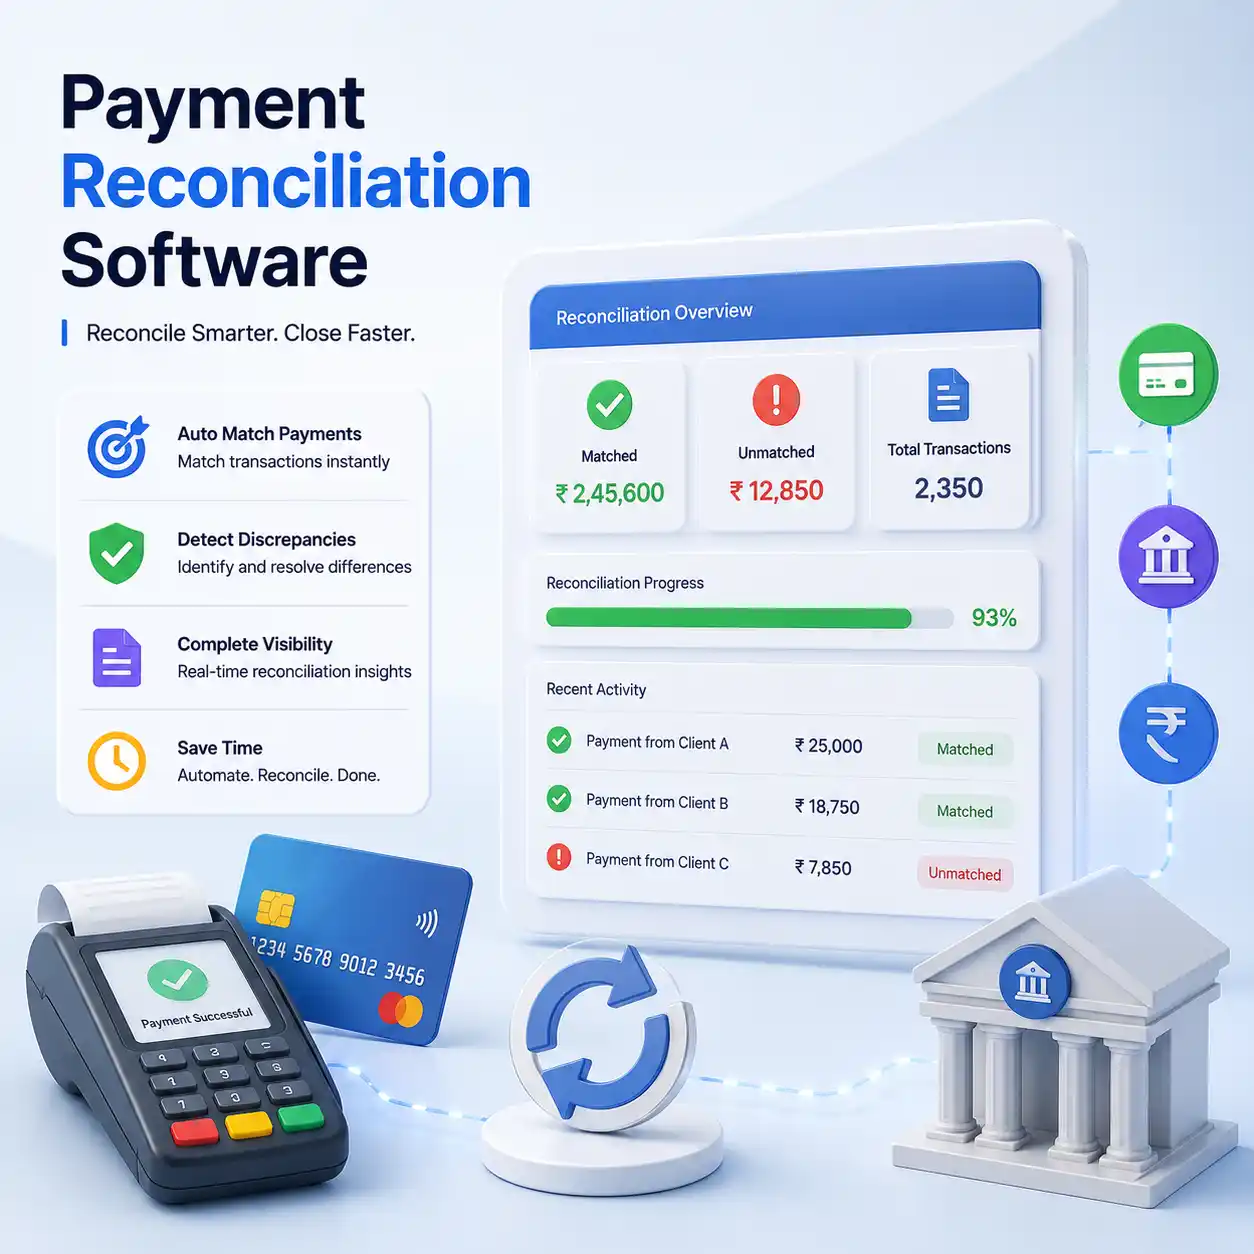
Knowledge graphs play a major role here by organizing transaction metadata so that automated software can trace the exact lineage of every single dollar. This graph-powered structure enables smooth automated reconciliation, which maps financial data points back to their source documents with total transparency.
When your transactional data is semantically linked, deploying an intelligent bank reconciliation tool becomes much simpler. The tool can navigate through the data network to match internal cash balances with external banking records effortlessly, reducing manual interventions and highlighting reporting discrepancies in real time.
Key Benefits of Implementing Knowledge Graphs
Adopting a graph-based data architecture offers immediate strategic and financial advantages to enterprise financial institutions.
Eliminating Corporate Data Silos
Large banks frequently suffer from fragmented internal systems where retail banking, commercial lending, and wealth management divisions operate on completely separate software platforms. Knowledge graphs act as an intelligent semantic layer that sits on top of existing applications. They connect disparate data models without requiring organizations to expensive overhaul their underlying legacy infrastructure.
Grounding Generative AI and LLMs
As financial institutions adopt Large Language Models (LLMs) and generative AI tools to assist analysts, data accuracy is vital. Standard AI models can hallucinate or deliver generic answers.
By linking an LLM to an enterprise knowledge graph, a practice known as Graph Retrieval-Augmented Generation (GraphRAG), the AI is forced to pull facts directly from the verified corporate data network. This ensures that the automated insights generated for market research, investment strategies, or customer inquiries are highly accurate, contextualized, and fully explainable.
Accelerating Operational Efficiency
Manual data entry and matching drain hours of productivity from accounting and operations departments. Knowledge graphs streamline these back-office activities by providing clear context to transactional data.
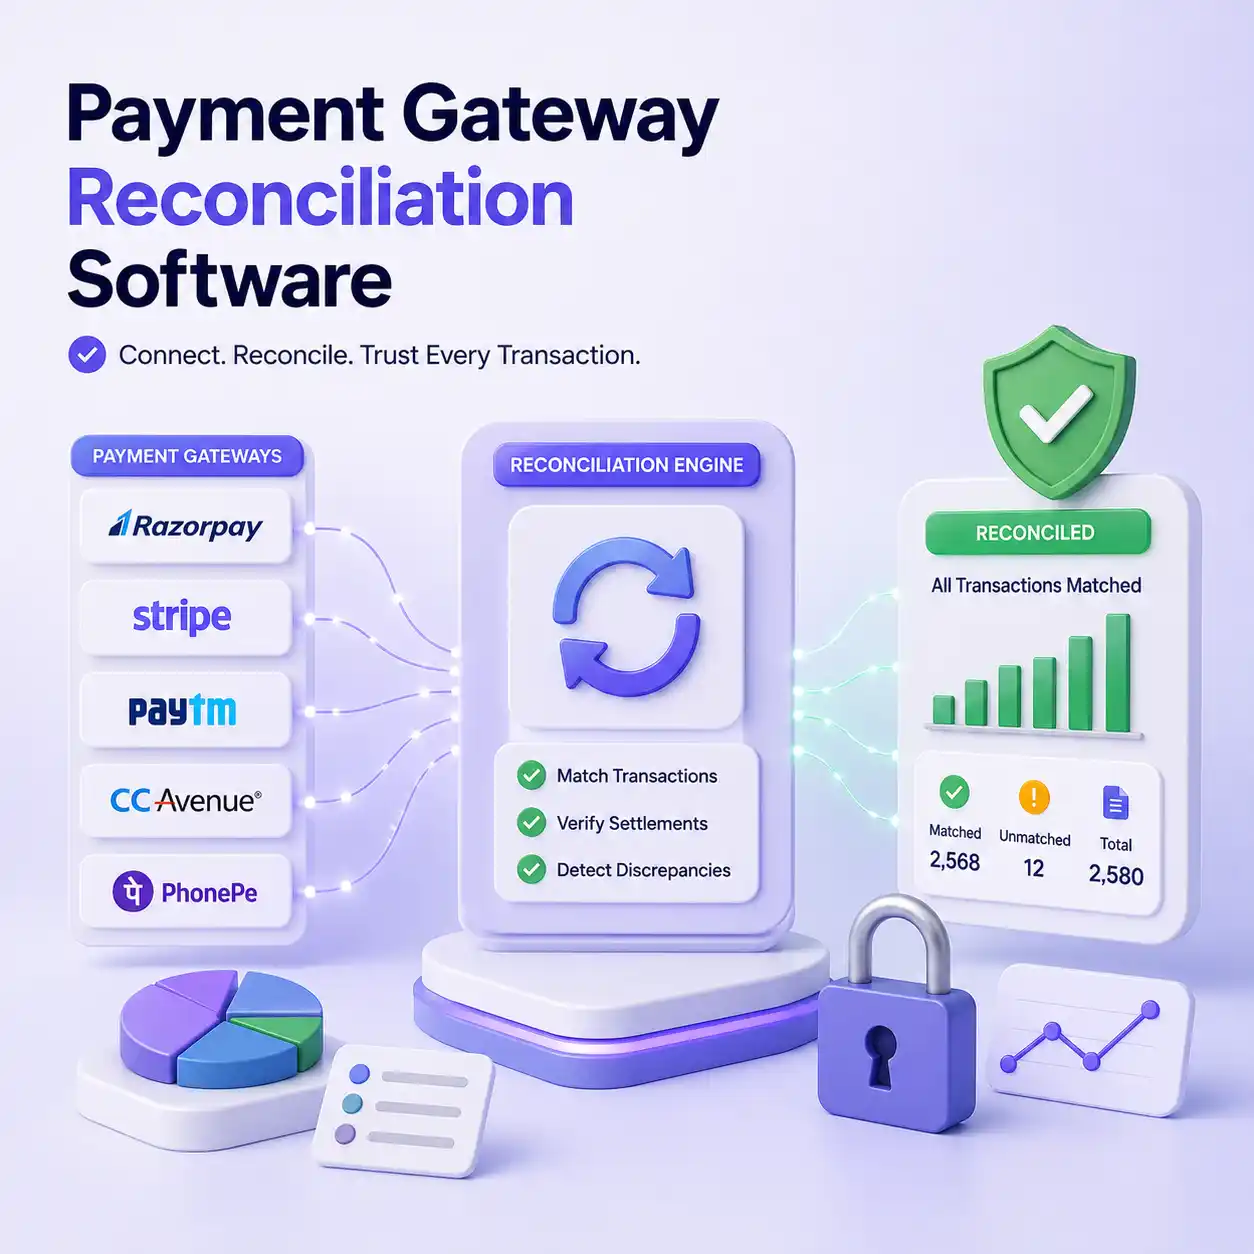
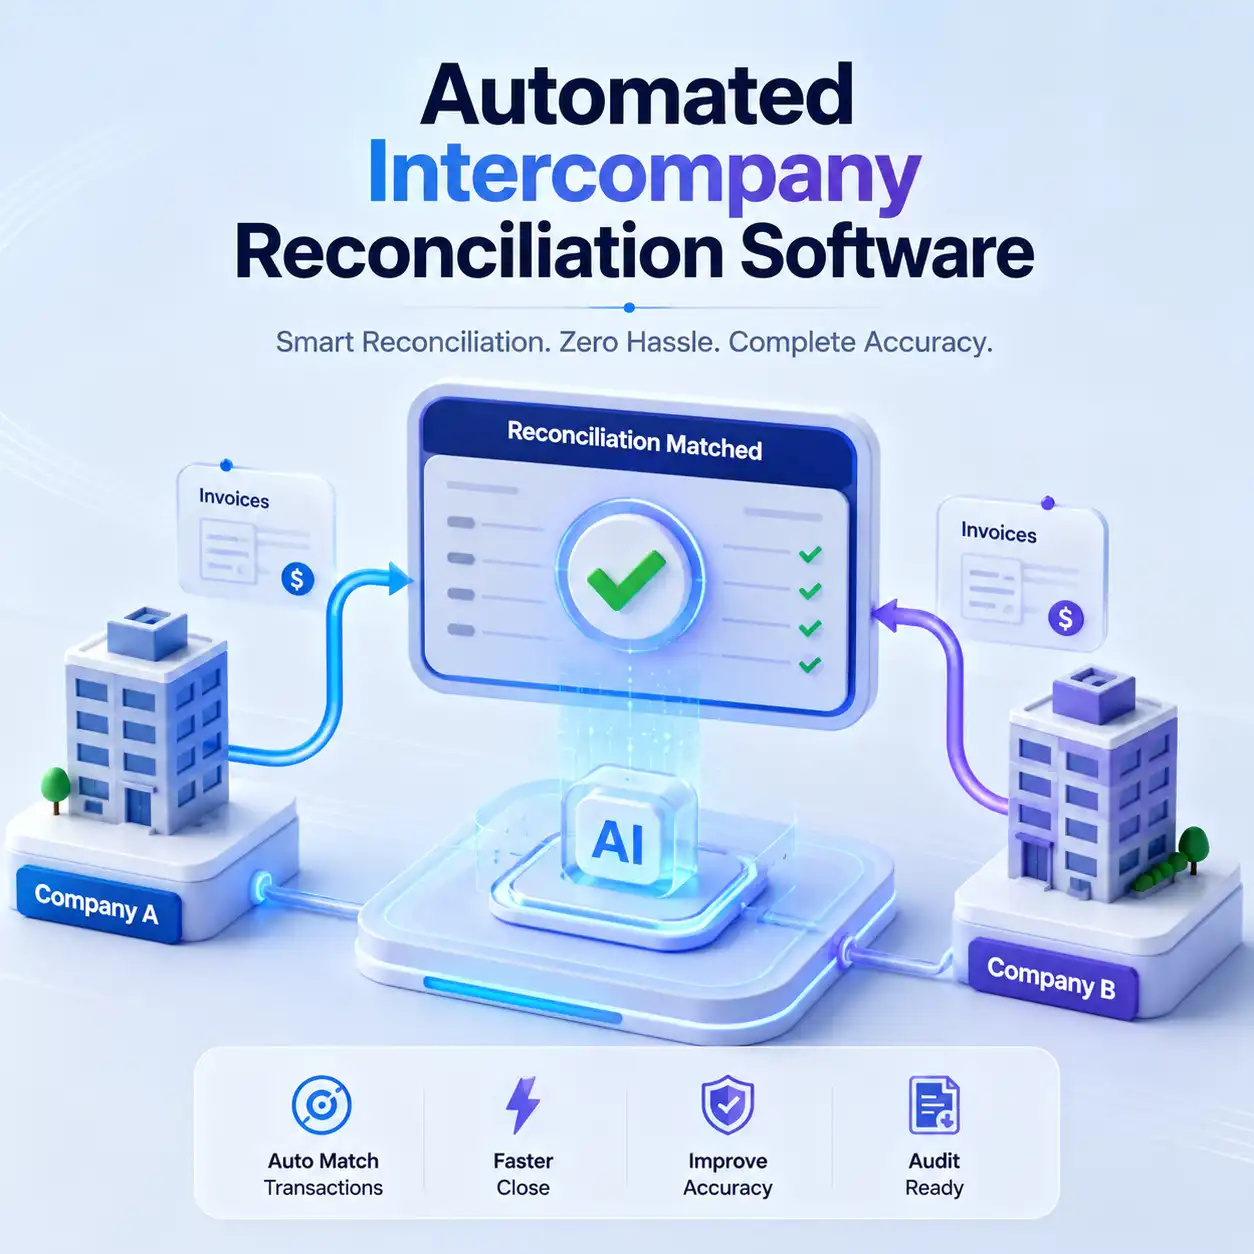
For example, when dealing with complex corporate cash positions across multiple digital channels, businesses can leverage automated payment reconciliation engines powered by graph logic to automatically match incoming client payments with open invoices. Similarly, organizations can run automated cash reconciliation routines to instantly verify liquidity pools across global bank accounts. This eliminates manual tracking errors and frees up internal finance professionals to focus entirely on high-value financial planning and analysis.
The Future of Knowledge Graphs in Financial Operations
As we move through 2026, the financial sector is experiencing a major shift toward continuous, real-time financial tracking. The traditional approach of waiting for monthly or quarterly book-closing cycles is being replaced by real-time data visibility. Modern CFOs are increasingly demanding instant insights to manage market risks and adjust enterprise corporate budgets dynamically.
Knowledge graphs provide the perfect data foundation for this real-time transition. By handling continuous data ingestion, these graphs allow institutions to monitor operational fluctuations the moment they occur. When combined with emerging agentic AI systems, financial knowledge graphs will soon move from basic observation to autonomous decision-making. They will assist organizations in predicting working capital shortages, adjusting investment portfolios instantly, and stopping fraudulent transactions before they are even processed.
Frequently Asked Questions
What makes a knowledge graph different from a standard relational database?
A standard relational database organizes data rigidly into tables with fixed rows and columns, requiring complex joins to find connections between different datasets. A knowledge graph stores data natively as interconnected entities (nodes) and relationships (edges). This allows the system to prioritize connections and query deeply nested relationships across billions of data points much faster.
How do knowledge graphs help financial institutions spot money laundering?
Money laundering often involves moving funds through circular paths across multiple shell companies and bank accounts. Knowledge graphs track the flow of funds across borders and instantly map out ownership hierarchies. This allows compliance teams to easily see the ultimate beneficial owner of an account and uncover hidden networks that try to hide their identity.
Can knowledge graphs be integrated with existing legacy core banking systems?
Yes. One of the biggest operational advantages of a knowledge graph is that it serves as an overlay semantic layer. Financial institutions do not need to replace or rewrite their legacy core databases. Instead, data pipelines extract information from existing legacy applications, map it to a unified graph model, and link the data points externally.
Why is data context so important for automated financial reconciliation tools?
Financial reconciliation often struggles with missing text, mismatched transaction IDs, or timing variations across different bank ledgers. When transaction data contains rich semantic context provided by a knowledge graph, reconciliation engines can look beyond simple text matching. They can analyze the surrounding data relationships, such as counterparty names, timestamps, and payment channels, to match records with much greater accuracy.
What is GraphRAG and how does it protect financial data applications?
GraphRAG stands for Graph Retrieval-Augmented Generation. It is a process where a generative AI model or LLM is linked directly to a verified knowledge graph. Before answering a user prompt, the AI retrieves structured, factual data points from the graph. This baseline context prevents the AI from inventing information, ensuring that financial reports, regulatory compliance summaries, and automated audits remain highly reliable.
See How Kosh AI Can Transform Financial Close
Contact us now