YTD (Year-to-Date) Performance
Navigating financial statements and performance reviews can feel like learning a completely new language. If you have ever looked at a company budget sheet, an investment portfolio statement, or even a basic payroll slip, you have likely come across the acronym YTD.
Understanding YTD performance metrics is essential for anyone who wants to monitor the financial health of a business, track investment growth, or manage corporate budgets. This comprehensive guide breaks down everything beginners need to know about Year-to-Date metrics, how they work, why they matter, and how to use them effectively in daily financial operations.
Understanding the Basics of Year-to-Date (YTD)
Year-to-Date, commonly abbreviated as YTD, is a financial term that refers to the period starting from the first day of the current calendar or fiscal year up to the present date. Instead of looking at a isolated block of time like a single week or a single month, YTD offers a cumulative look at data. It allows business owners, investors, and finance managers to see a running total of their progress over the months that have already passed in the current annual cycle.
When managers analyze performance using YTD metrics, they are looking at a moving picture that captures all the financial activities that have occurred since the year began. This makes it an incredibly powerful tool for understanding real-time trends and seeing if a company is truly moving toward its long-term annual goals.
The Difference Between Calendar Year and Fiscal Year
To use YTD metrics accurately, it is important to understand that the starting point of your data depends entirely on the type of year your organization follows.
Calendar Year to Date
The calendar year is the standard twelve month period that begins on January 1st and ends on December 31st. For companies and individual investors operating on a calendar year, the YTD calculation always starts tracking data on January 1st. If you look at a YTD statement on June 30th, the data reflects exactly six months of cumulative activity.
Fiscal Year to Date
A fiscal year is a customized twelve month period chosen by an organization or government for financial reporting and auditing purposes. Not every business starts its financial year in January. For example, many corporations choose a fiscal year that aligns with their specific business cycles, or they follow regional regulatory frameworks where the official fiscal year begins on April 1st. For these organizations, Fiscal YTD tracks data from the very first day of that specific fiscal period up to the current date.
Why Are YTD Performance Metrics Important?
Relying solely on monthly reports can sometimes give an inaccurate view of performance. A company might have an incredible month in sales due to a one-time client deal, or a terrible month due to seasonal dips. Looking at these months in isolation can cause unnecessary panic or false confidence.
YTD metrics smooth out these short-term fluctuations by providing a broader, cumulative viewpoint. Recent financial updates show that companies tracking mid-year parameters can successfully identify operational issues long before the annual audit arrives. Here are the primary reasons why tracking YTD metrics is highly beneficial for modern operations:
- Accurate Trend Analysis: YTD summaries combine the peaks and troughs of different months, allowing management to see the true underlying trajectory of the business.
- Proactive Course Correction: If a corporate department is overspending, waiting until the end of the twelve month period to review the budget is a recipe for disaster. YTD metrics show exactly how much of the annual budget has been consumed so far, allowing leadership to implement cost-cutting measures immediately.
- Streamlined Forecasting: Financial planning and analysis teams rely heavily on YTD figures to build reliable projections. By dividing the YTD revenue by the number of days passed and multiplying it by 365, analysts can form a realistic baseline for where the company will finish at year-end.
Core Types of YTD Metrics in Business and Finance
YTD is not a standalone metric, rather, it is a time frame modifier applied to several different financial components. The most common metrics utilizing this timeframe include:
YTD Revenue and Sales
This is the total amount of money generated from goods sold or services rendered from the beginning of the year to the present day. Corporate sales teams monitor YTD sales closely to see if they are meeting their historical growth targets and current annual quotas.
YTD Expenses
This metric tracks all the operational costs, overhead, and capital expenditures incurred during the year up to the current date. Tracking YTD expenses ensures that internal departments remain within their allocated budgets. Keeping an eye on this data manually can be incredibly tedious, which is why many forward-thinking finance teams implement an account reconciliation tool to keep historical expense data organized and accurate.
YTD Earnings and Profits
YTD Earnings represent the actual net income generated after subtracting total expenses from total revenue during the specified timeframe. This metric tells you whether the company is running a sustainable profit margin or operating at a loss as the year progresses.
YTD Return on Investment (ROI)
Commonly used by portfolio managers and individual investors, YTD return measures the profit or loss an asset has made since the first day of the calendar year. It is expressed as a percentage and helps individuals gauge whether their investment strategies are successfully beating industry benchmarks.
How to Calculate YTD Values
Calculating a basic YTD value is simple and requires straightforward addition. To find a cumulative YTD metric, you simply add up the values of each completed period from the start of the year to the current moment.
The Basic YTD Formula
$$\text{YTD Value} = \sum (\text{Value of Month 1} + \text{Value of Month 2} + \dots + \text{Value of Current Month})$$
For example, let us assume your business generated the following monthly revenues:
- January: $50,000
- February: $60,000
- March: $45,000
- April: $55,000
If you want to find your YTD revenue as of April 30th, the calculation would look like this:
$$\text{YTD Revenue} = \$50,000 + \$60,000 + \$45,000 + \$55,000 = \$210,000$$
Calculating YTD Growth Percentage
To understand if your current performance is better or worse than the previous year, you must calculate the YTD growth percentage. This compares the current YTD value against the YTD value from the exact same period last year.
$$\text{YTD Growth \%} = \frac{\text{Current YTD Value} - \text{Prior Year YTD Value}}{\text{Prior Year YTD Value}} \times 100$$
If your YTD revenue by April of last year was $180,000 and it is $210,000 this year, your calculation would be:
$$\text{YTD Growth \%} = \frac{\$210,000 - \$180,000}{\$180,000} \times 100 = 16.67\%$$
This confirms that your business performance is tracking 16.67% ahead of where it stood at the exact same point during the previous annual cycle.
Best Practices for Evaluating YTD Performance
While YTD data provides exceptional visibility, it can lead to incorrect conclusions if it is not analyzed carefully. To get the most accurate insights out of your data, keep these fundamental principles in mind:
Always Factor in Seasonality
Many industries experience natural fluctuations throughout the year. For instance, retail businesses often make a significant portion of their annual revenue during the final holiday quarter. If a retail brand calculates its YTD performance in June, it might look like it is lagging behind its annual targets. However, this is perfectly normal due to seasonal patterns. Always compare current data against the corresponding historical timelines rather than assuming uniform distribution across the months.
Ensure Equal Comparison Periods
When comparing your metrics to competitors or prior years, ensure that the timeframes match exactly. Comparing a YTD report ending on May 15th of this year to a historical report ending on May 31st of last year will produce skewed results. Consistent date ranges are vital for data integrity.
Maintain Clean Financial Records
The insights you get from YTD reports are only as good as the raw data you enter into your system. If bank statements are unrecorded, invoices are delayed, or transactional errors are left unchecked, your cumulative reports will be completely inaccurate. This highlights the crucial need for modern accounting practices like payment reconciliation to ensure every transaction is cleared, verified, and categorized in real time.
Streamlining Performance Tracking with Automation
For growing businesses handling hundreds or thousands of transactions daily, calculating cumulative metrics manually via spreadsheets is highly inefficient. Human errors in data entry can distort your financial reporting, making your YTD insights unreliable.
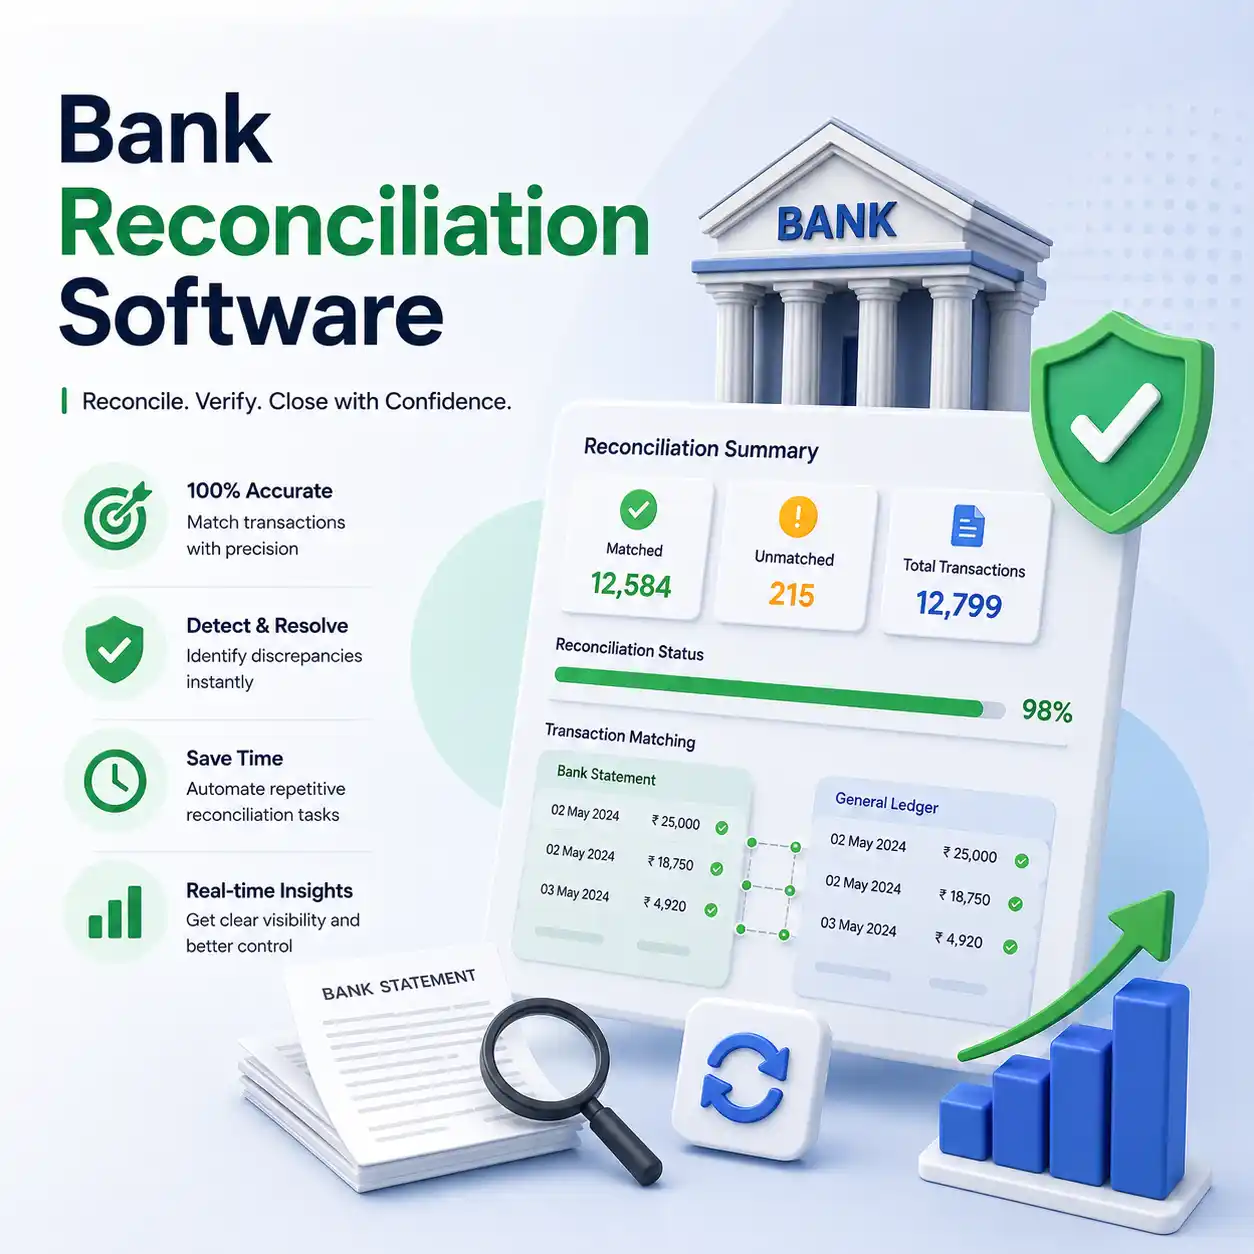
To eliminate these bottlenecks, modern enterprises utilize a dedicated bank reconciliation software to automatically match bank balances with internal ledgers. By implementing systems that offer automated reconciliation, finance leaders can instantly view real-time, error-free YTD data with the simple click of a button. This level of automation ensures that your performance metrics are always built upon verified, updated financial truths, giving you total confidence when presenting numbers to stakeholders and executives.
Summary
Year-to-Date performance metrics serve as an essential roadmap for understanding a company's financial trajectory. By tracking cumulative revenues, expenditures, and profits from day one of the fiscal or calendar year, beginners and seasoned professionals alike can gain deep, actionable insights into operational trends. When supported by clean books and modern automated systems, YTD analysis empowers you to make informed decisions that ensure your long-term annual goals are met with absolute precision.
Frequently Asked Questions
What does YTD mean on a pay stub?
On a employee pay stub, YTD stands for Year-to-Date. It displays the cumulative amount of money you have earned, as well as the total amount of taxes, healthcare premiums, and retirement contributions withheld from your paycheck since January 1st of the current calendar year.
Can YTD be longer than a year?
No, YTD can never exceed a single calendar or fiscal year. The time frame reset happens automatically on the very first day of the new fiscal or calendar cycle, at which point the cumulative calculation drops back down to zero and starts over.
What is the difference between YTD and MTD?
While YTD (Year-to-Date) tracks cumulative data from the beginning of the annual cycle to the current day, MTD (Month-to-Date) only tracks data collected from the first day of the current month to the present date. MTD is useful for short-term operational reviews, whereas YTD provides a broader view of long-term financial health.
Why is my fiscal YTD different from my calendar YTD?
Your fiscal YTD will differ from your calendar YTD if your organization uses a customized accounting year that does not start on January 1st. For instance, if your company's official fiscal year begins on April 1st, your fiscal YTD will only calculate data starting from April 1st, whereas your calendar YTD will always start on January 1st.
How does automation improve YTD tracking?
Automation eliminates manual data entry mistakes and ensures that transactions are categorized instantly. By integrating automated financial software, your company can cross-reference bank data with internal books in real-time, giving you access to accurate, up-to-the-minute YTD performance tracking without spreadsheet delays.
See How Kosh AI Can Transform Financial Close
Contact us now