Top Reconciliation Metrics Every CFO Should Monitor
Kosh.ai
July 13, 2026
The modern financial landscape demands speed, precision, and strategic foresight. For a Chief Financial Officer (CFO), managing data across multiple entities, payment gateways, and banking institutions is no longer just an operational task. It is a core strategic function. According to recent financial benchmarks, 50% of finance teams require six or more business days to finalize their month-end books. In contrast, best-in-class teams leveraging modern financial practices complete the process in under three days.
At the heart of a lengthy month-end close lies the reconciliation process. When balance matching is handled manually via traditional spreadsheets, it acts as an invisible drain on company resources. It increases risk and obscures clear visibility into cash positions. To transform finance from a reactive department into a proactive powerhouse, modern CFOs must shift away from outdated ledger management. Instead, they need to focus on key quantitative indicators.
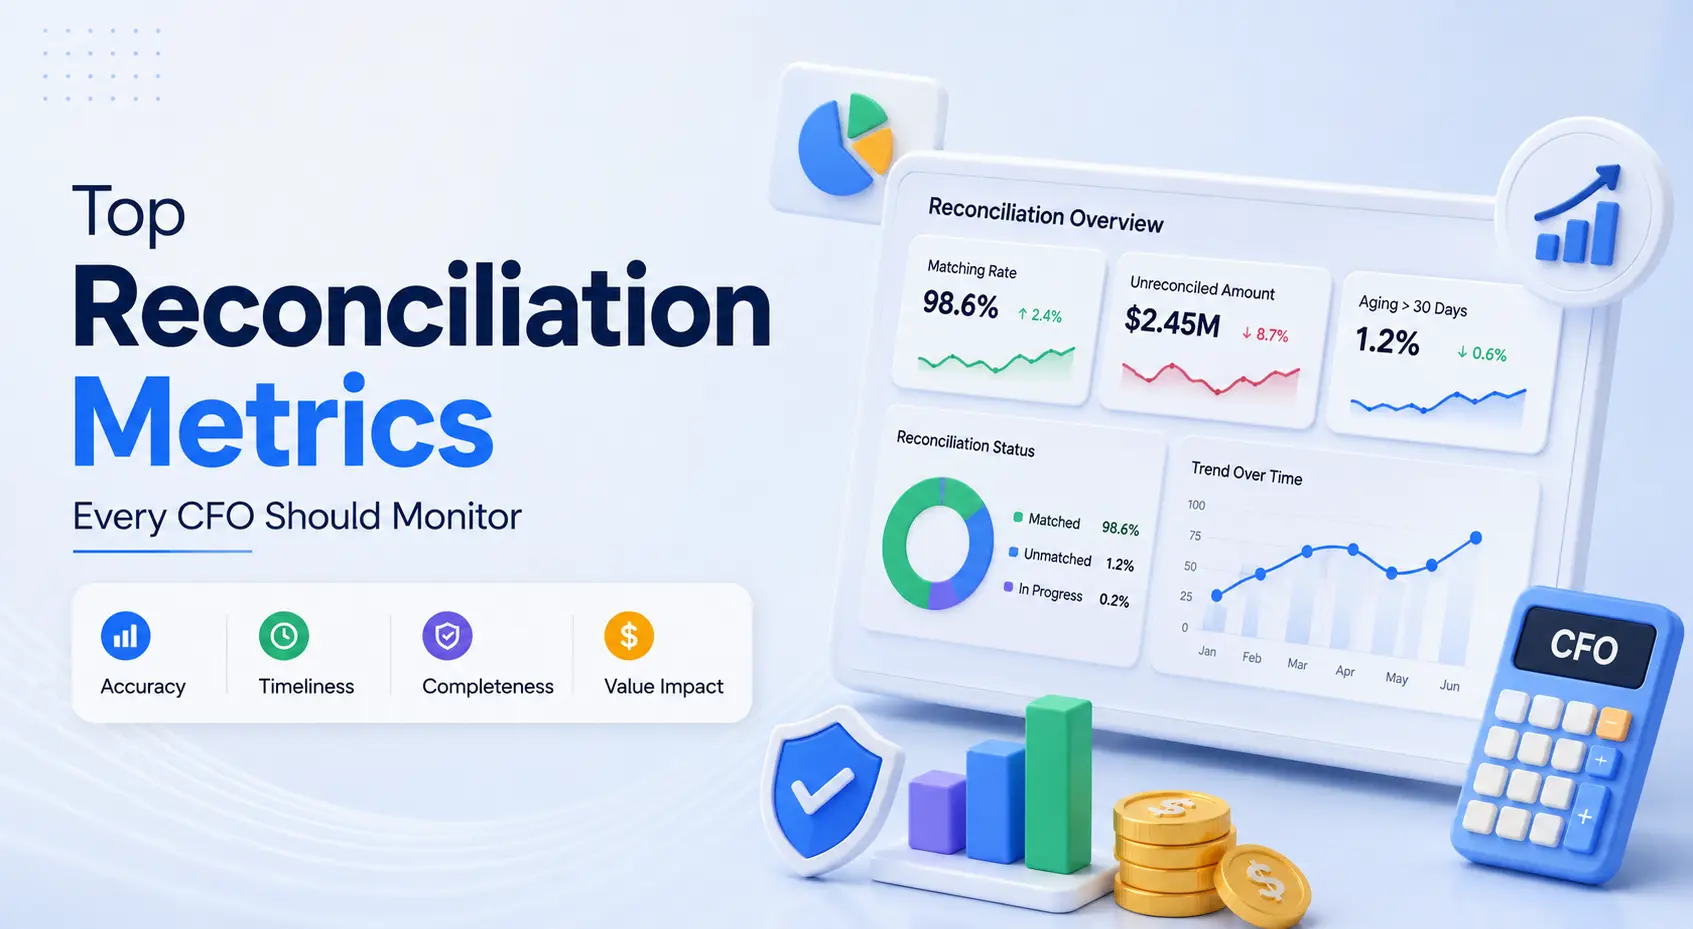
By tracking data-driven reconciliation metrics, leaders can uncover process inefficiencies, prevent costly errors, and protect the organization's bottom line. Below are the top reconciliation metrics that every CFO should monitor to ensure structural accuracy, operational health, and scalable growth.
1. Auto-Match Rate
The auto-match rate measures the percentage of financial transactions that are successfully paired across different data sets by software algorithms without requiring human intervention. It serves as the ultimate barometer for the maturity and efficiency of your financial infrastructure.
Auto-Match Rate = (Number of Automatically Matched Transactions / Total Number of Transactions) * 100
When finance teams spend hours manually cross-referencing line items from bank statements against internal ledgers, the risk of human error skyrockets. A low auto-match rate indicates that your team is bogged down by tedious data entry, which directly delays financial reporting.
Many organizations find that spreadsheet-based matching becomes incredibly difficult to scale when transaction volumes exceed 5,000 per month. By implementing automated reconciliation solutions, companies can automatically match the vast majority of transactions instantly based on predefined rules like date, amount, and reference codes.
Monitoring this metric allows a CFO to understand exactly how much operational friction exists in the daily workflow. A high auto-match rate reduces labor costs, eliminates human data entry mistakes, and frees up your finance professionals to focus on higher-value tasks such as financial forecasting, budget optimization, and risk mitigation.
2. Exception Volume and Rate
No matter how advanced your financial systems are, certain transactions will fail to match. These are known as exceptions. The exception rate calculates the percentage of total transactions that contain discrepancies, such as mismatched amounts, missing transaction IDs, or timing differences.
Exception Rate = (Number of Unmatched Transactions / Total Number of Transactions) * 100
While tracking the overall volume of exceptions is helpful for daily operational monitoring, tracking the exception rate provides a clear view of systemic data quality. A sudden spike in your exception rate can signal deep-rooted issues, such as a malfunctioning point-of-sale system, an unannounced change in a payment gateway's data export format, or potential internal fraud.
For a CFO, keeping a close eye on exception rates is vital for maintaining tight internal controls. If your team faces a mountain of unresolved exceptions at the end of the month, your financial close will inevitably slow down. By monitoring this metric weekly or even daily, you can identify patterns, address data silos, and fix underlying systemic issues before they snowball into major reporting delays.
3. Mean Time to Resolve (MTTR) Exceptions
Discovering a transaction mismatch is only the first step. The true test of operational efficiency is how quickly your team can investigate and fix it. The Mean Time to Resolve (MTTR) measures the average time it takes from the moment an exception is flagged to the moment it is completely resolved in the general ledger.
MTTR = Total Time Spent Resolving Exceptions / Total Number of Resolved Exceptions
When exception resolution relies on endless internal emails, manual file exports, and constant back-and-forth communication between departments, the MTTR can stretch into days or even weeks. This creates a severe bottleneck that halts the entire closing sequence. Recent data reveals that bad or lagging data prevents 49% of CFOs from making critical business decisions on time.
A prolonged MTTR means your cash visibility remains clouded, which directly impacts short-term liquidity planning. Tracking this metric helps a CFO evaluate whether the finance team has the right tools to collaborate and investigate variances efficiently. Shorter resolution times mean cleaner financial records and a more agile close cycle.
4. Unreconciled Aging Backlog
The unreconciled aging backlog categorizes all outstanding, unmatched transactions based on how long they have remained open, typically in buckets of 30, 60, or 90+ days. This metric provides an immediate health check of your balance sheet's historical accuracy.
An aging backlog that creeps past the 60-day mark is a red flag for any financial leader. The older an unresolved transaction gets, the harder it becomes to track down the supporting documentation, verify the transaction with the operational team, or recover lost funds from external vendors.
A large backlog of aged items compromises the integrity of interim financial statements and creates significant compliance risks during audit season. CFOs should treat the 90+ day bucket as a zero-tolerance zone, using it to drive accountability and enforce stricter variance resolution policies across the board.
5. Cost Per Reconciled Transaction
Efficiency is not just about speed and accuracy; it is also about fiscal responsibility. The cost per reconciled transaction calculates the total financial investment required to process and validate your transactions over a given period. This includes software licensing fees, operational overhead, and the direct labor costs of the staff assigned to matching tasks.
Cost Per Reconciled Transaction = Total Reconciliation Operational Costs / Total Number of Reconciled Transactions
Manual processing is an expensive endeavor. Benchmarks indicate that while top-performing automated teams can bring the administrative cost of processing financial documents down significantly, manual operations regularly incur steep expenses due to excessive labor hours and administrative re-work.
Manual vs. Automated Efficiency:
[ Manual Processing ]  ---> High Labor Hours ---> Avg. Cost: High
[ Automated Matching ] ---> Low Labor Hours  ---> Avg. Cost: ~70% Lower
If your business is growing and transaction volumes are expanding, a rising cost per transaction proves that your current operational model is unsustainable. Tracking this metric helps a CFO build a clear, data-driven business case for technology investments. Lowering this cost through structured optimization directly improves operational efficiency and protects your bottom line.
6. Manual Intervention Rate
The manual intervention rate tracks the percentage of total transactions that require hands-on adjustments, manual spreadsheet inputs, or journal entry overrides by an accountant to achieve a successful match.
Manual Intervention Rate = (Number of Manually Adjusted Transactions / Total Number of Transactions) * 100
This metric is the inverse twin of your auto-match rate, but it focuses specifically on the human resource drain. A high manual intervention rate means your skilled accounting professionals are spending their valuable time acting as manual data processors rather than financial analysts.
When accountants spend hours copying and pasting data from bank feeds into legacy systems, employee burnout and turnover risks rise significantly. Industry surveys highlight that multi-entity matching struggles and chaotic manual workflows are leading causes of voluntary departures among top finance talent. Monitoring this rate allows CFOs to pinpoint exactly where workflows are broken and where smart validation rules can eliminate redundant labor.
7. Operational Close Cycle Time
The close cycle time measures the total number of business days required to finalize the company’s financial records and publish the official statements after a period ends. Because reconciliation is often the single largest bottleneck in this timeline, the efficiency of your matching workflows dictates your overall speed.
Recent 2025 and 2026 industry benchmarks show that only 18% of finance teams manage to close their month-end books in three days or less. The remaining majority often takes upwards of a week, meaning leadership is forced to review stale data.
A prolonged close cycle time delays financial planning and analysis (FP&A) teams from creating accurate forecasts, leaving the company flat-footed in a fast-moving market. By monitoring this metric alongside specific matching milestones, a CFO can identify exactly which sub-processes are dragging down the organization's agility.
8. Bank Statement to Ledger Accuracy
Maintaining a perfect match between your internal general ledger and real-world bank records is fundamental to corporate compliance. The bank statement to ledger accuracy metric tracks the frequency, volume, and value of unexplained variances between your cash accounts and external bank statements.
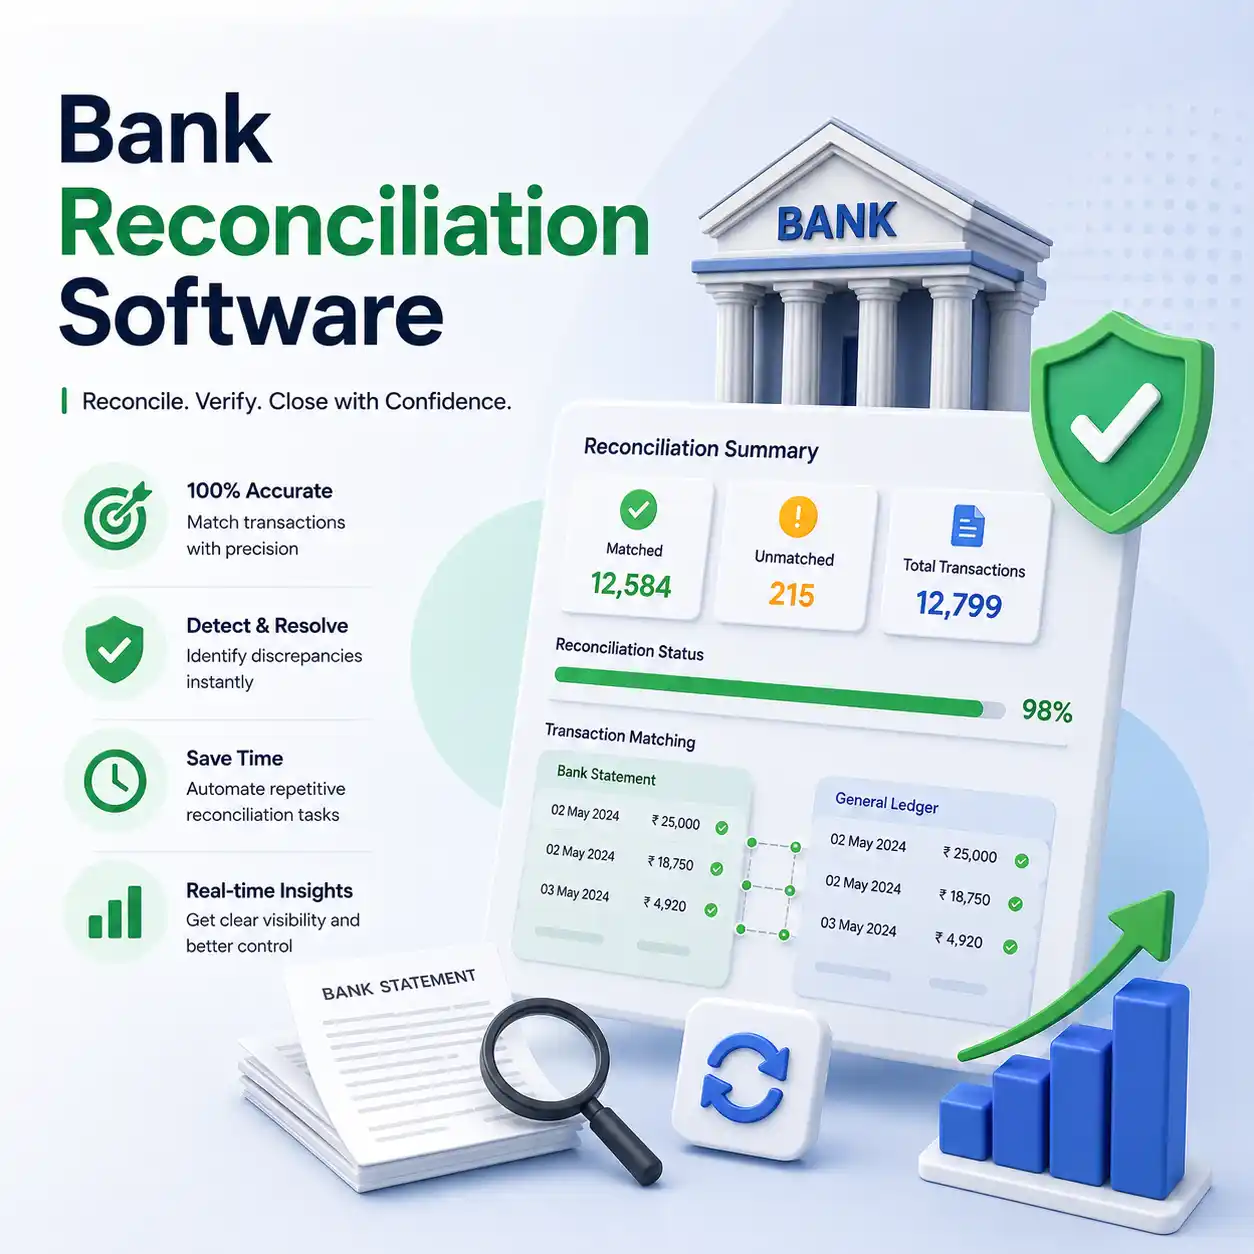
To keep this metric at an optimal level, organizations rely on modern bank reconciliation systems. These platforms pull real-time data feeds directly from banking institutions, eliminating the need to wait until the end of the month to download CSV files and hunt for discrepancies.
A lack of real-time visibility into bank balances can result in overdraft fees, missed vendor discounts, or undetected unauthorized withdrawals. For a CFO, monitoring this accuracy metric daily ensures that the company’s stated cash position is entirely dependable, providing a solid foundation for capital allocation and investment decisions.
9. Gateway to Bank Settlement Consistency
For e-commerce, retail, and subscription-based enterprises, tracking cash across various point-of-sale networks and merchant processors is a complex challenge. The gateway to bank settlement consistency metric monitors the percentage of customer payments captured by your front-end systems that successfully settle into your corporate bank accounts.
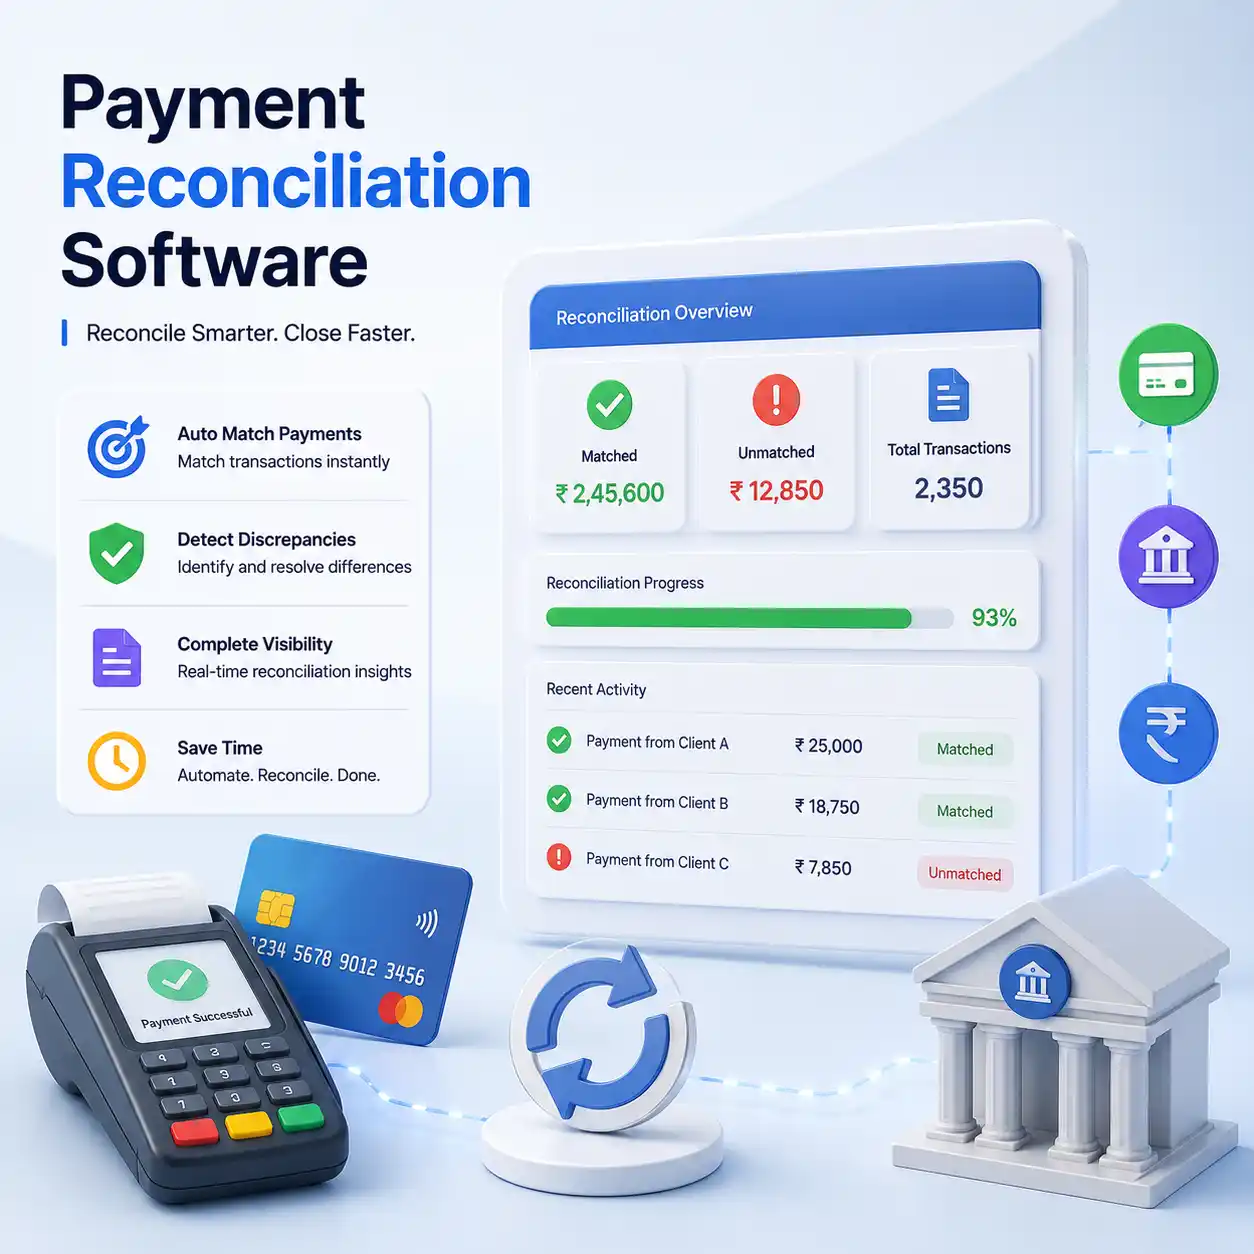
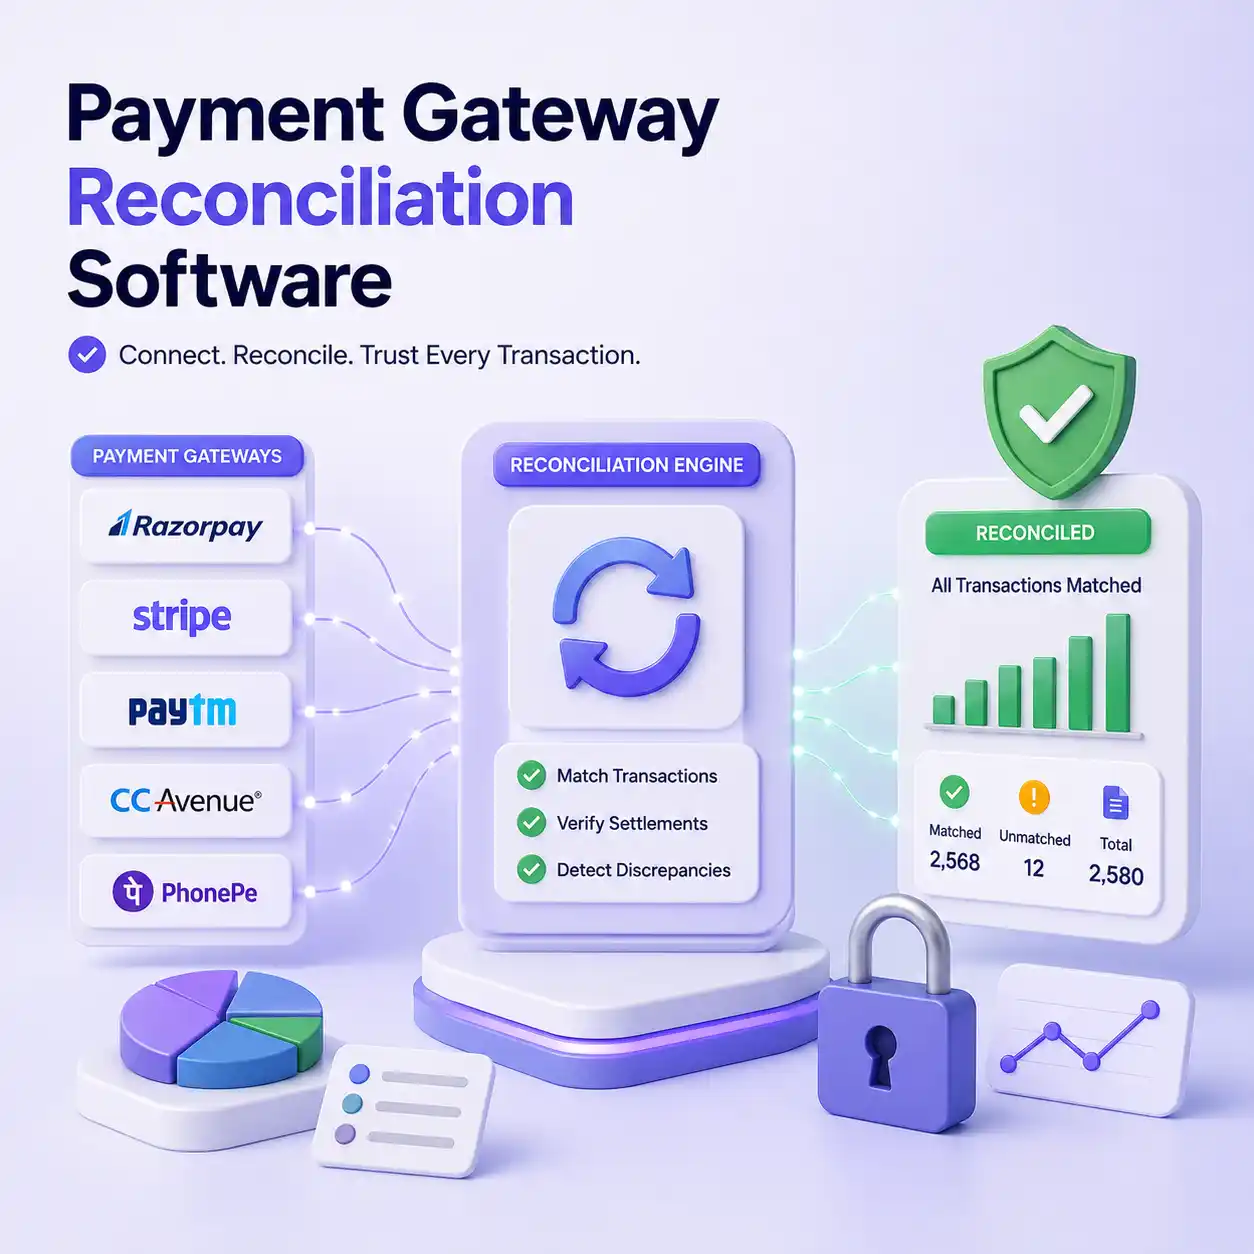
Managing these multi-layered deposit structures requires dedicated payment reconciliation workflows. Merchant processors often deduct processing fees, chargebacks, and reserve amounts before depositing funds, making direct matching difficult.
If this metric drops, it means cash is trapped somewhere in the payment pipeline or being drained by unverified processing fees. By tracking settlement consistency, a CFO can verify that every dollar processed online actually makes it to the company bank account, protecting profit margins from hidden revenue leakage.
10. Cash Position Variance
The cash position variance metric measures the difference between your projected daily cash flow and your actual, verified cash balances. Accurate forecasting depends entirely on having real-time data from all cash touchpoints.
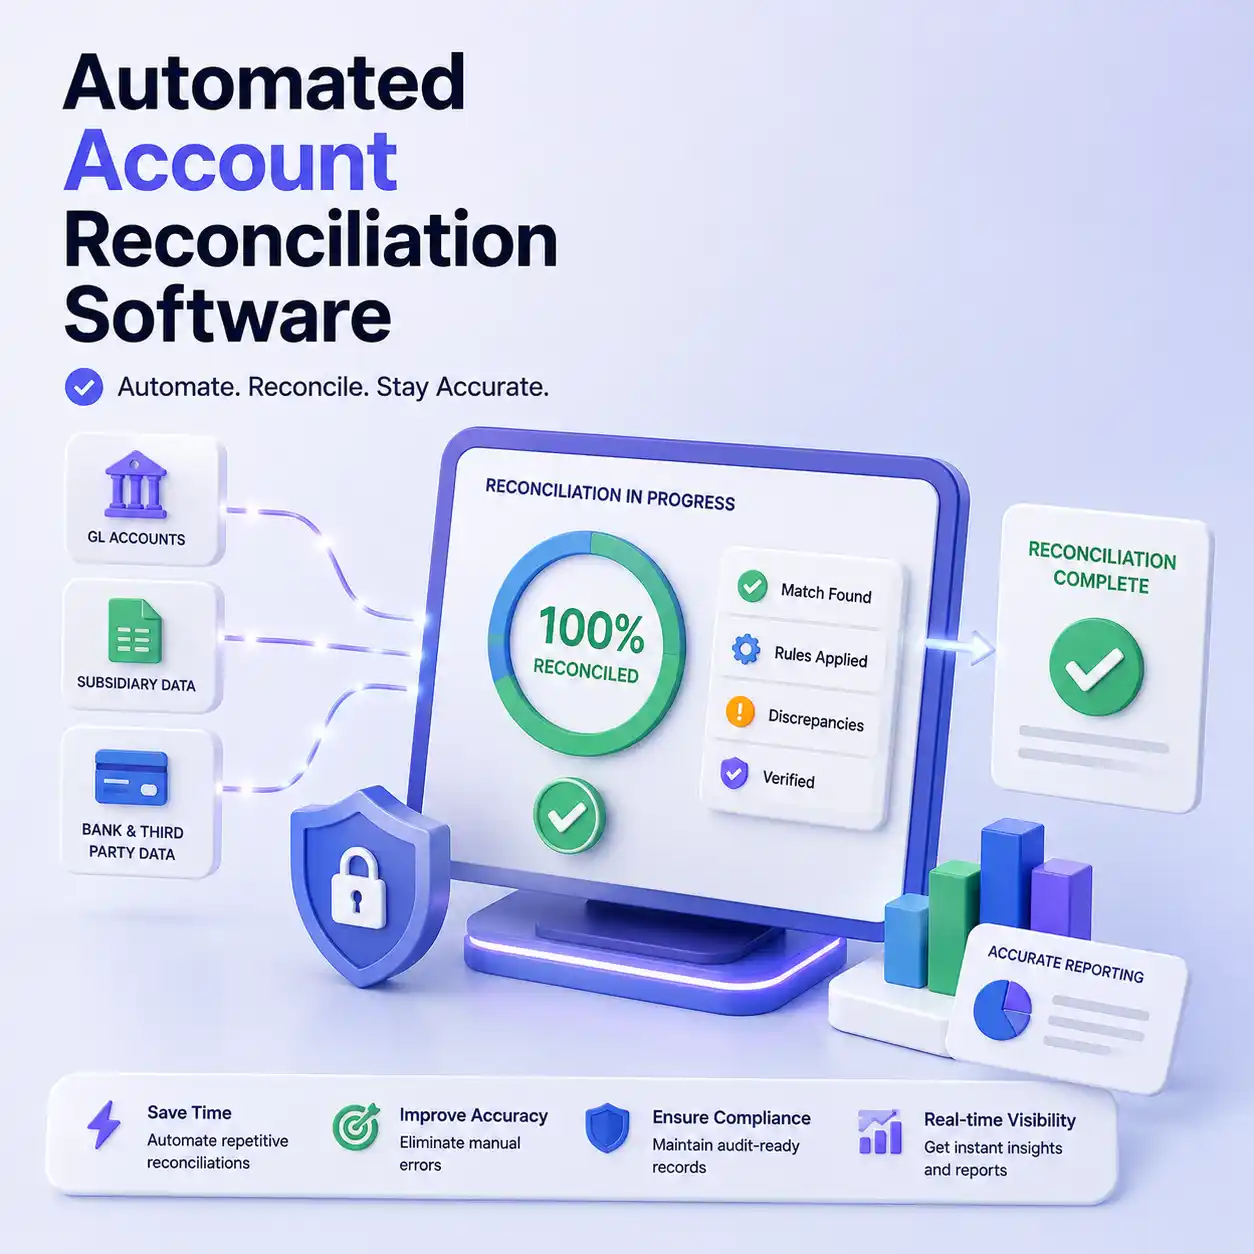
To minimize these variances, companies use advanced cash reconciliation frameworks. These frameworks systematically match cash inflows and outflows across operational units, petty cash funds, and short-term holdings.
A high cash position variance forces companies into a reactive stance, often leading to unnecessary short-term borrowing or missed opportunities to invest idle capital. By monitoring this metric closely, a CFO can refine cash flow forecasting models, optimize working capital, and ensure the business always maintains ideal liquidity levels.
11. Intercompany Discrepancy Rate
For multinational corporations and multi-entity businesses, tracking internal transactions is a common operational hurdle. The intercompany discrepancy rate measures the frequency and value of unmatched balances, transfer pricing errors, and cross-border transactions between sister companies or parent and subsidiary entities.
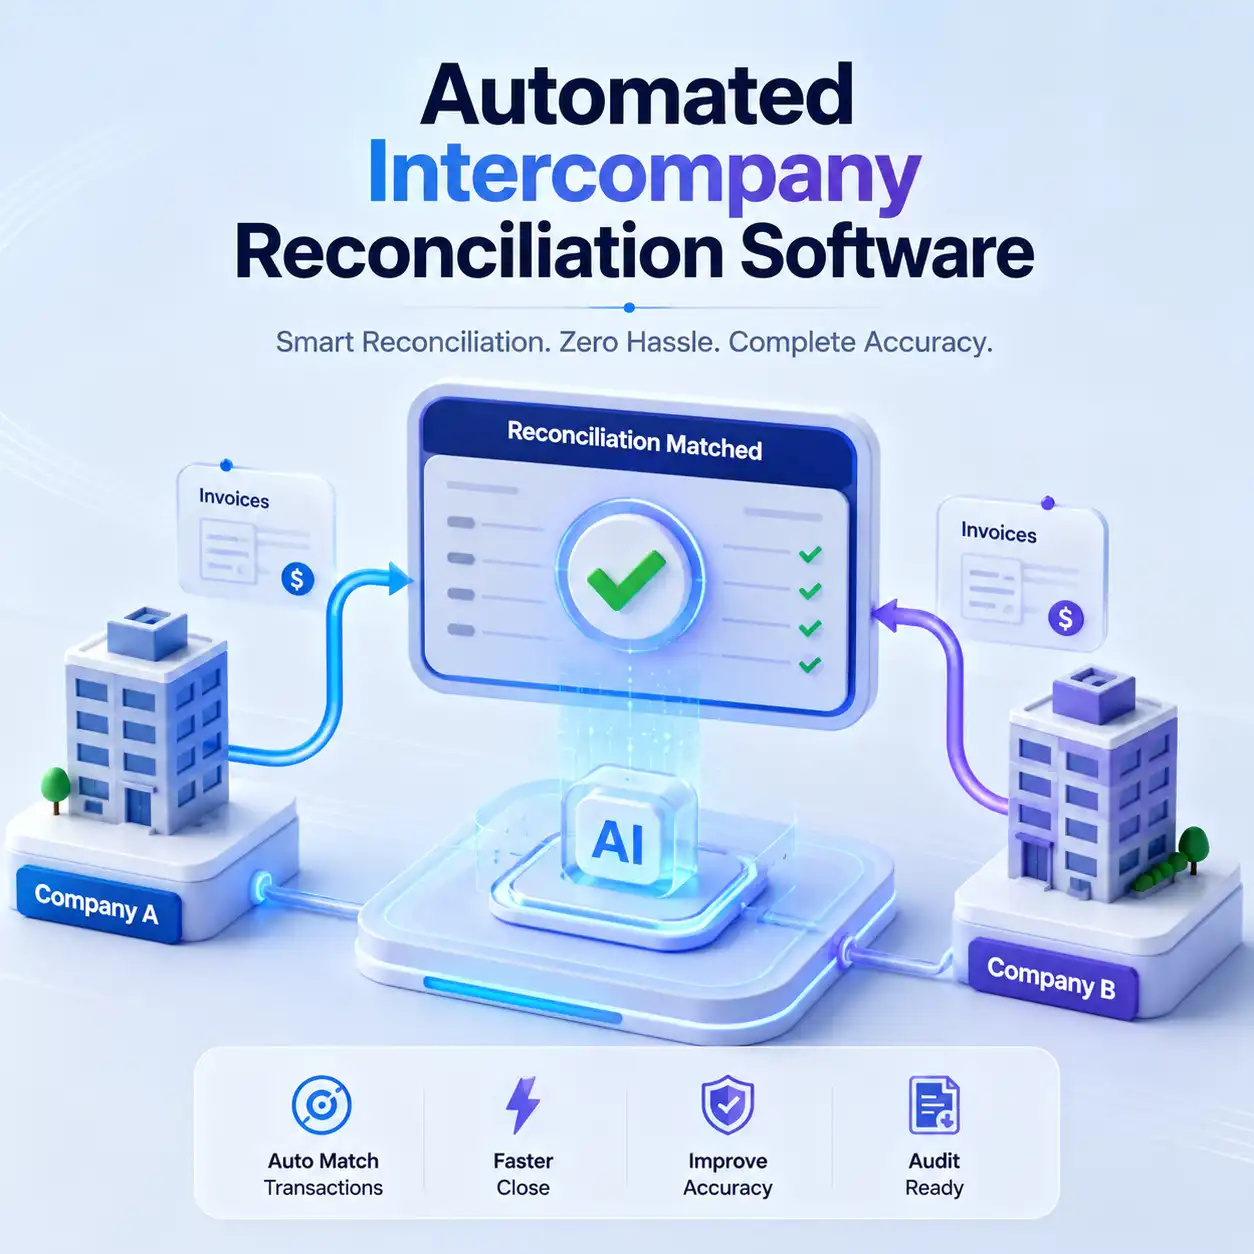
Studies reveal that an astonishing 99% of multinational corporations struggle with internal corporate balancing. Resolving these issues requires specialized intercompany reconciliation systems that run parallel matching and automated eliminations across different corporate hierarchies.
Unresolved intercompany mismatches can distort consolidated financial reporting, lead to double-counting of revenue, and trigger serious compliance penalties during tax audits. CFOs must track this rate to guarantee that all internal balances eliminate perfectly upon consolidation, ensuring compliance across all operating regions.
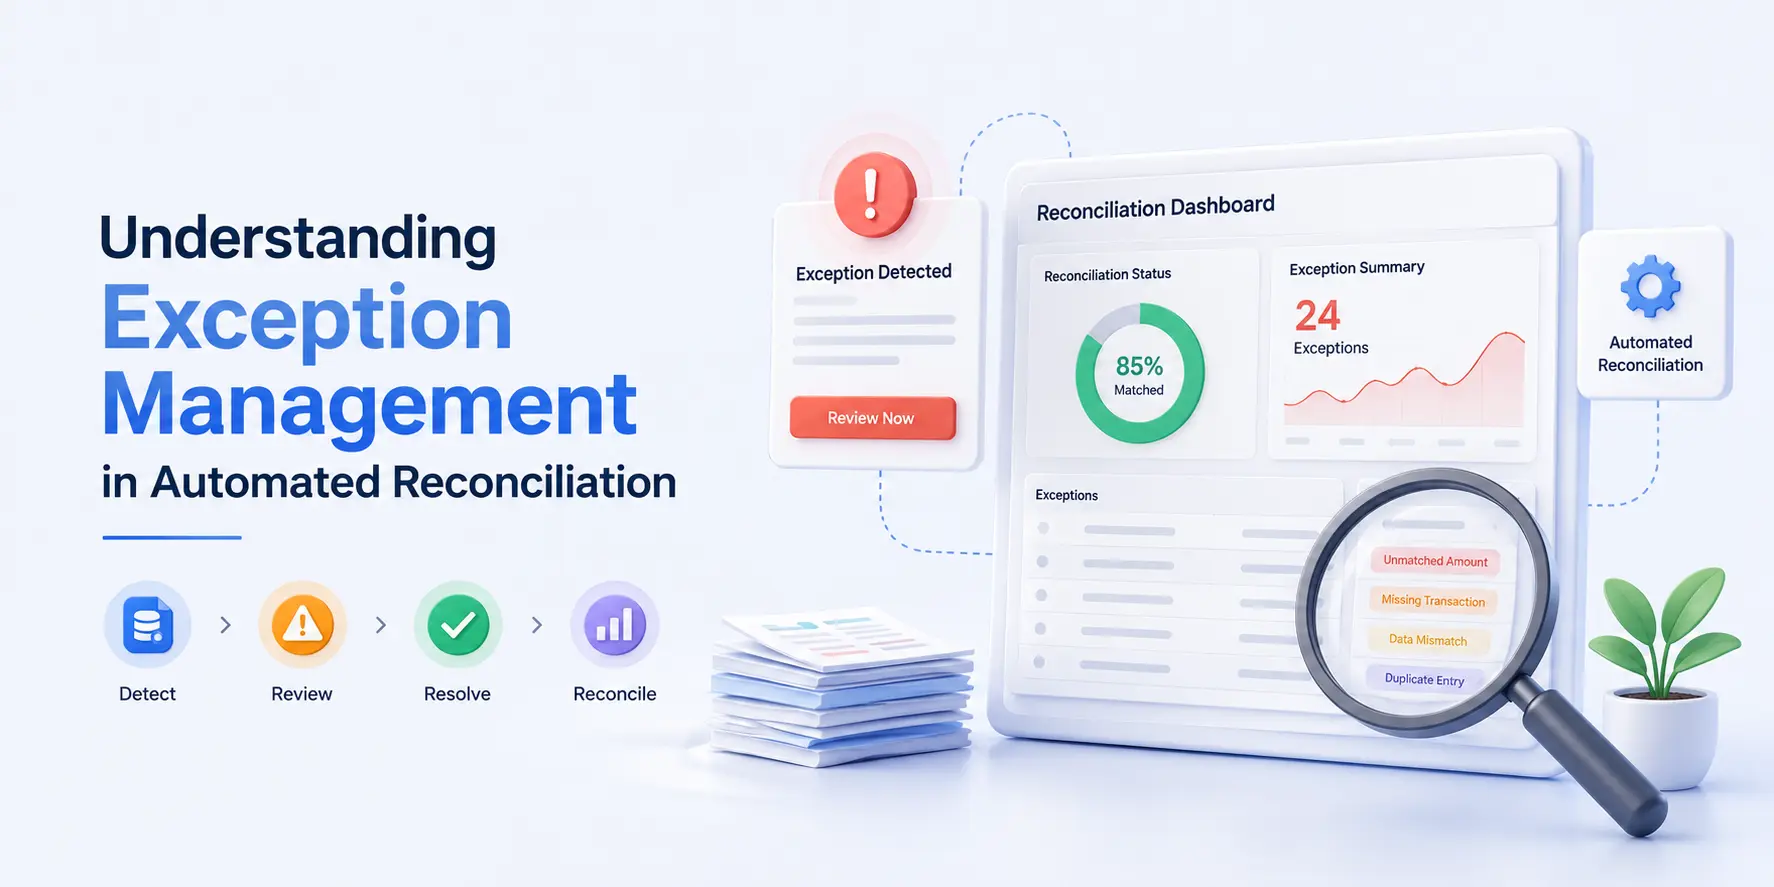
Also Read: Understanding Exception Management in Automated Reconciliation
Frequently Asked Questions
Why should a CFO care about reconciliation metrics?
Reconciliation metrics provide quantitative proof of the health, speed, and accuracy of an organization’s financial operations. Rather than treating accounting as a black box, monitoring these metrics allows a CFO to pinpoint operational bottlenecks, reduce labor overhead, eliminate revenue leakage, and ensure financial data is completely trustworthy for strategic decision-making.
How does automation improve the financial close cycle?
Automation accelerates the close cycle by eliminating manual, spreadsheet-based matching rules. Intelligent systems can ingest massive volumes of data from ERPs, banks, and payment gateways simultaneously, matching transactions in parallel. This eliminates manual data entry, cuts the consolidation workload by up to 50%, and reduces the close timeline from weeks to a few days.
What are the main causes of high exception rates?
High exception rates are usually caused by fragmented data, disconnected financial systems, timing differences between internal records and external banks, or manual errors during data entry. Systemic changes, such as a payment gateway altering its reporting format without notice, can also cause a sudden spike in exceptions.
How do intercompany mismatches impact consolidated financial statements?
When transactions between subsidiaries or sister entities do not match perfectly, it creates imbalances that distort the corporate balance sheet. If left unresolved, these mismatches can result in the artificial inflation of revenues or expenses, leading to inaccurate consolidated reporting and serious regulatory and tax compliance risks during audits.
What is a healthy auto-match rate benchmark for growing companies?
While the ideal rate varies by industry and transaction complexity, top-performing enterprises utilizing modern financial technology aim for an auto-match rate of 90% or higher. Achieving this level of automation ensures that the accounting team only needs to spend time on exception handling and strategic analysis.
How does manual data processing impact employee retention in finance teams?
Repetitive, manual data entry tasks like copying and pasting line items across spreadsheets often lead to high stress and employee burnout. Studies show that chaotic manual workflows and broken month-end close processes are top reasons why skilled finance professionals choose to leave their organizations. Implementing smart tools improves job satisfaction and team productivity.
Ready to get started?
Contact us now
Contact us now
* By clicking on Contact Us you are agreeing to our Terms & Conditions and Privacy policy.